. 2023 Feb 10;13(1):2440.
doi: 10.1038/s41598-023-29489-w.

Differential expression patterns of long noncoding RNAs in a pleiomorphic diatom and relation to hyposalinity

Affiliations

Differential expression patterns of long noncoding RNAs in a pleiomorphic diatom and relation to hyposalinity

Ahmed Debit et al. Sci Rep. .

Abstract

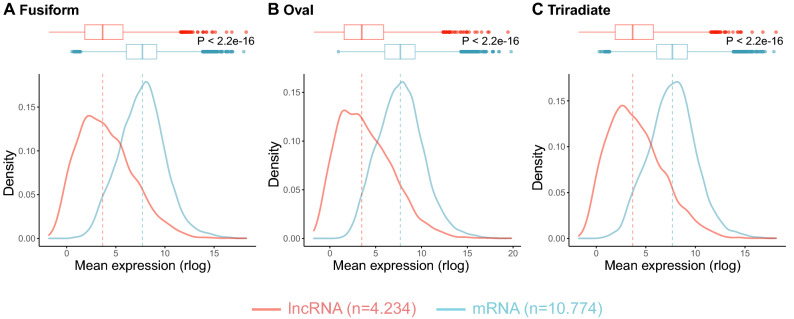
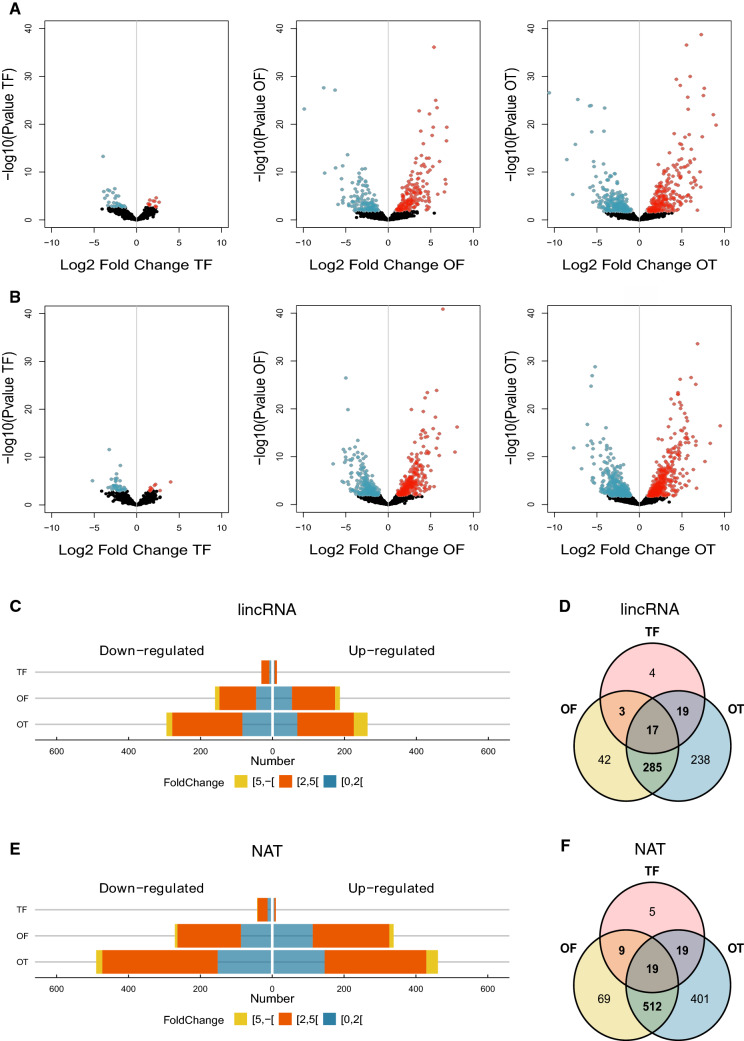
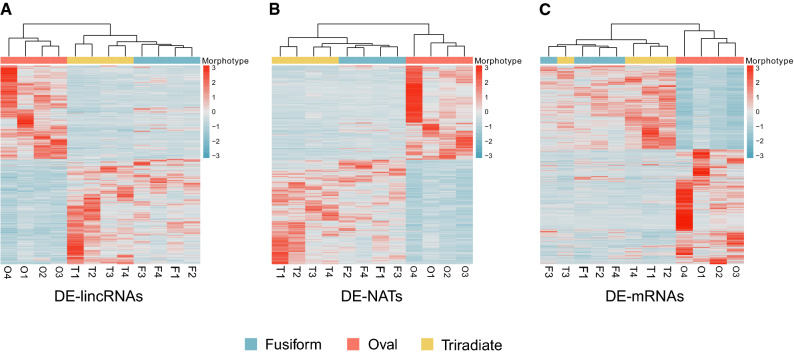
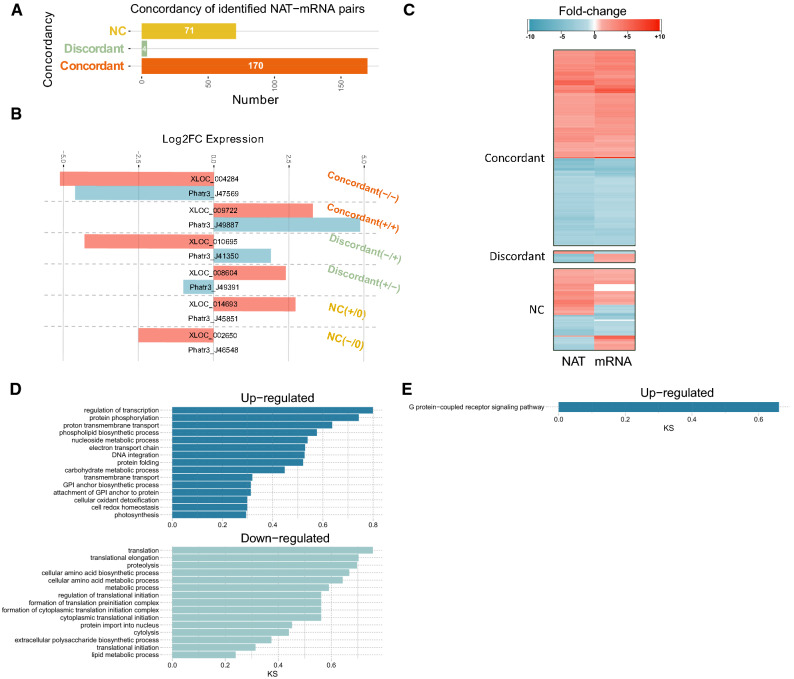
Long non-coding (lnc)RNAs have been shown to have central roles in stress responses, cell identity and developmental processes in multicellular organisms as well as in unicellular fungi. Previous works have shown the occurrence of lncRNAs in diatoms, namely in Phaeodactylum tricornutum, many of which being expressed under specific stress conditions. Interestingly, P. tricornutum is the only known diatom that has a demonstrated morphological plasticity, occurring in three distinct morphotypes: fusiform, triradiate and oval. Although the morphotypes are interchangeable, the fusiform is the dominant one while both the triradiate and the oval forms are less common, the latter often being associated with stress conditions such as low salinity and solid culture media, amongst others. Nonetheless, the molecular basis underpinning morphotype identity in P. tricornutum remains elusive. Using twelve previously published transcriptomic datasets originating from the three morphotypes of P. tricornutum, we sought to investigate the expression patterns of lncRNAs (lincRNAs and NATs) in these distinct morphotypes, using pairwise comparisons, in order to explore the putative involvement of these noncoding molecules in morphotype identity. We found that differentially expressed lncRNAs cluster according to morphotype, indicating that lncRNAs are not randomly expressed, but rather seem to provide a specific (noncoding) transcriptomic signature of the morphotype. We also present evidence to suggest that the major differences in DE genes (both noncoding and coding) between the stress related oval morphotype and the most common fusiform morphotype could be due, to a large extent, to the hyposaline culture conditions rather than to the morphotype itself. However, several lncRNAs associated to each one of the three morphotypes were identified, which could have a potential role in morphotype (or cell) identity in P. tricornutum, similar to what has been found in both animals and plant development.


Conflict of interest statement

The authors declare no competing interests.

Figures

Figure 1
Figure 1
Expression level differences between coding and noncoding transcripts in P. tricornutum morphotypes. We measured the expression level differences between mRNAs and lncRNAs within the three transcriptomes: (A) Fusiform, (B) Oval, and (C) Triradiate. The sets of coding and non-coding were first filtered (filtering out lowly expressed transcripts) using the CPM method from the NOISeq package, and the number of transcripts retained for downstream analysis is displayed in parentheses. The data were then normalized using the rlog function from the DESeq2 package. Figures were made using the “Wes Anderson” color palette “Zissou1” in R (https://github.com/karthik/wesanderson).
Figure 2
Figure 2
Differentially expressed long noncoding RNAs (lincRNAs and NATs) between the three morphotypes of P. tricornutum. Volcano plot showing the summary of the DE analysis for the three pairwise comparisons of lincRNAs (A) and NATs (B). The blue dots represent down-regulated transcripts while the red ones represent up-regulated transcripts. Dark dots represent the non-significantly DE transcripts. Pyramid plots representing the distribution of the significantly differentially expressed lincRNAs (C) and NATs (E) according to their log2FoldChange for each pairwise comparison. Venn diagram showing the intersection of DE lincRNAs (D) and (F) NATs between the three pairwise comparisons. TF, triradiate vs. fusiforme; OF, oval vs. fusiforme; OT, oval vs. triradiate. Figures were made using the “Wes Anderson” color palette “Zissou1” in R (https://github.com/karthik/wesanderson).
Figure 3
Figure 3
Clustering heatmaps of long noncoding (lincRNA and NAT) and coding transcripts from all three pairwise comparisons (TF, OF, OT). Heatmaps showing multi-group comparison of differentially expressed (A) lincRNAs (B) NATs, and (C) protein-coding transcripts (mRNA) in the three morphotypes. For each heatmap, the set of DE transcripts was taken as the union of DE transcripts of the three pairwise comparisons: T versus F, O versus F, and O versus T. DE transcripts are grouped by hierarchical clustering using the “complete” method and the “Euclidean” distance metric. The heatmaps were produced using the pheatmap R package. Figures were made using the “Wes Anderson” color palette “Zissou1” in R (https://github.com/karthik/wesanderson).
Figure 4
Figure 4
Characterization of the NAT-mRNA pairs detected in the Oval vs. the Fusiform pairwise comparison (OF). (A) Horizontal histogram showing the distribution of DE NAT-mRNA pairs according to the concordancy of the NAT and the corresponding cognate mRNA transcript. NC, low/no correlation (R2 ≤ 0.6) between NAT and its cognate mRNA. Discordant, NATs and their cognate mRNAs are DE with the opposite trend (one is upregulated while the other is downregulated), and Concordant, NATs and their cognate mRNAs are DE expressed with the same trend (negative or positive correlation), (B) fold expression change of two concordant, two discordant NAT-mRNA pairs, and one NC NAT-mRNA. (C) Heatmaps of log2 fold expression changes under morphotype change of the NAT-mRNA pairs (with positive and negative correlation) identified in P. tricornutum (R2 ≥ 0.6, fold change ≥ 2 or ≤ 1/2, and Adjusted p value < 0.05). Biological Process GO enrichment analysis of (D) concordant and (E) discordant NAT-mRNA pairs. Figures were made using the “Wes Anderson” color palette “Zissou1” in R (https://github.com/karthik/wesanderson).
Figure 5
Figure 5
Analysis of the hyposaline effect compared to the impact of the morphotype in Pt1. (A) Culture of Pt1 at normal vs hyposalinity.After more than a year under hyposaline conditions, no shift in morphology was observed when compared to the control (100% seawater). (B) RT-qPCR vs RNA-Seq correlation of the top 40 DE selected genes in the OF pairwise comparison (Pt1 fusiform under hyposalinity conditions vs OF) r = 0.7589, P value < 0.0001. (C) Correlation of the expression profile of the 40 most DE selected genes in the OF with their expression profile in the OT, they show an almost perfect correlation (Pearson, r = 0.9871, p < 0.0001). (D) RT-qPCR vs RNA-Seq correlation of the 40 DE selected genes (fusiform under low salinity stress vs OT), Pearson correlation, r = 0.7309, P value < 0.0001. A 2−ΔΔCt method was used for the normalization of the qPCR then a transformation was made to obtain the log2FoldChange. Correlation were performed using GraphPad Prism 9.4.1 analysis tool (Pearson correlation, P value Two-tailed, confidence interval 95%).

Similar articles

Cited by

References

    1. Sims PA, Mann DG, Medlin LK. Evolution of the diatoms: Insights from fossil, biological and molecular data. Phycologia. 2006;45:361–402. doi: 10.2216/05-22.1. - DOI
    1. Reyes-Prieto A, Weber APM, Bhattacharya D. The origin and establishment of the plastid in algae and plants. Annu. Rev. Genet. 2007;41:147–168. doi: 10.1146/annurev.genet.41.110306.130134. - DOI - PubMed
    1. Armbrust EV, et al. The genome of the diatom Thalassiosira pseudonana: Ecology, evolution, and metabolism. Science. 2004;306:79–86. doi: 10.1126/science.1101156. - DOI - PubMed
    1. Bowler C, et al. The Phaeodactylum genome reveals the evolutionary history of diatom genomes. Nature. 2008;456:239–244. doi: 10.1038/nature07410. - DOI - PubMed
    1. Allen AE, et al. Evolution and metabolic significance of the urea cycle in photosynthetic diatoms. Nature. 2011;473:203–207. doi: 10.1038/nature10074. - DOI - PubMed