. 2023 Feb 10;14(1):762.
doi: 10.1038/s41467-023-36400-8.

Loss of phosphatase CTDNEP1 potentiates aggressive medulloblastoma by triggering MYC amplification and genomic instability

Affiliations

Loss of phosphatase CTDNEP1 potentiates aggressive medulloblastoma by triggering MYC amplification and genomic instability

Zaili Luo et al. Nat Commun. .

Abstract

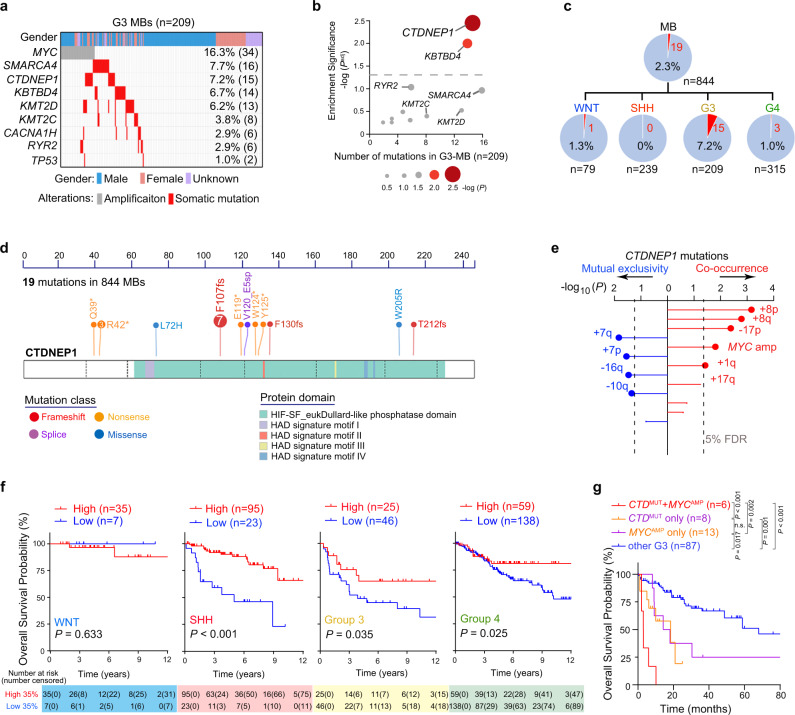
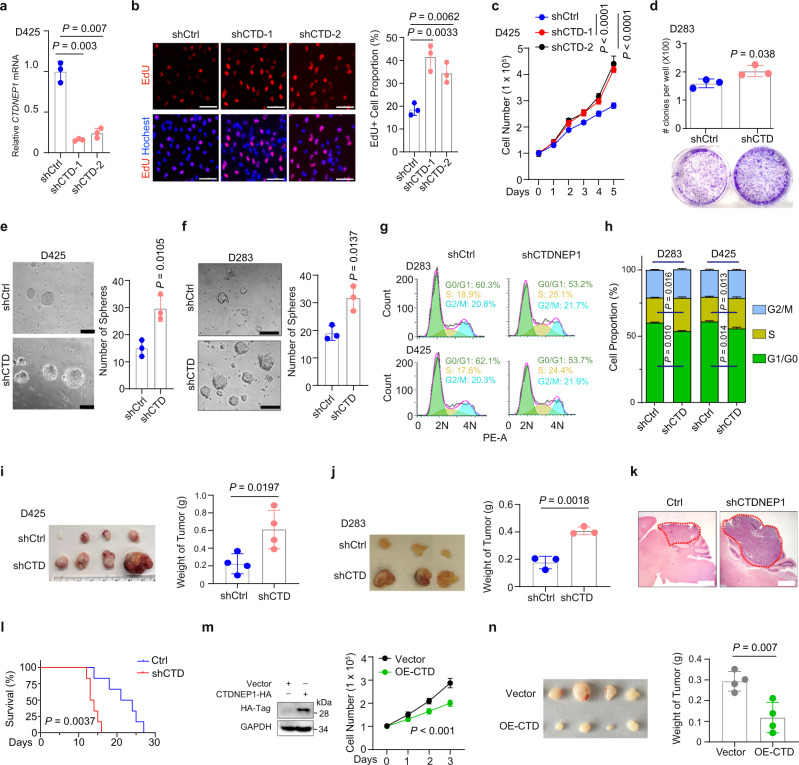
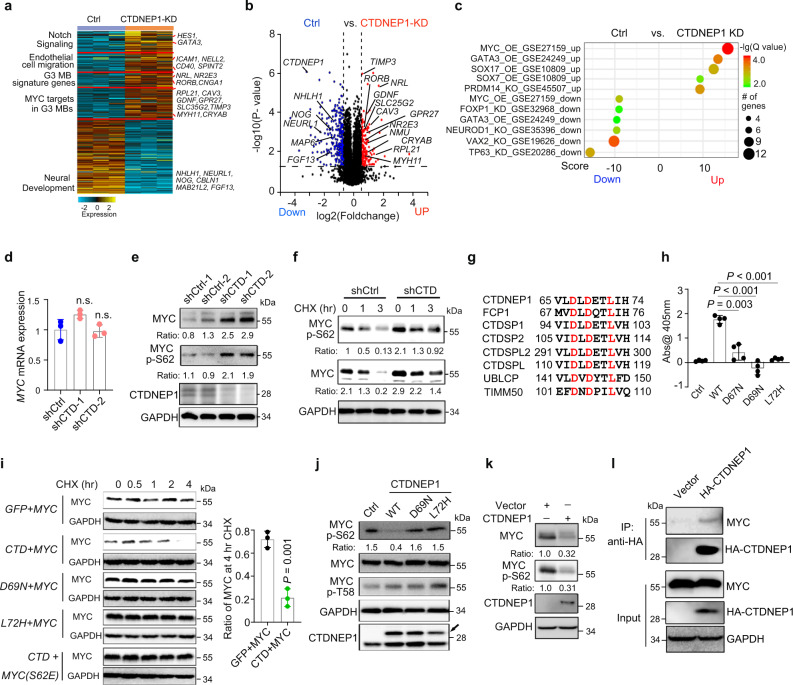
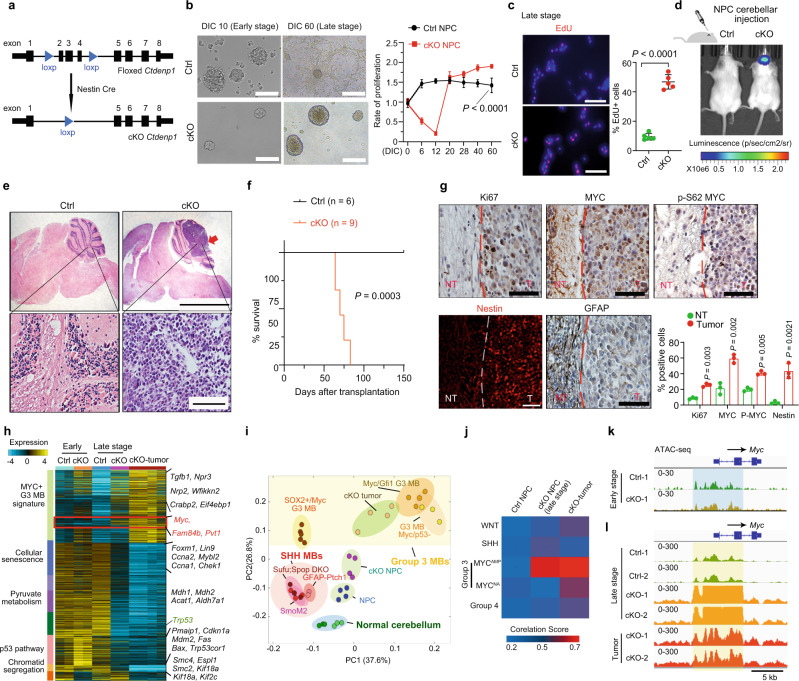
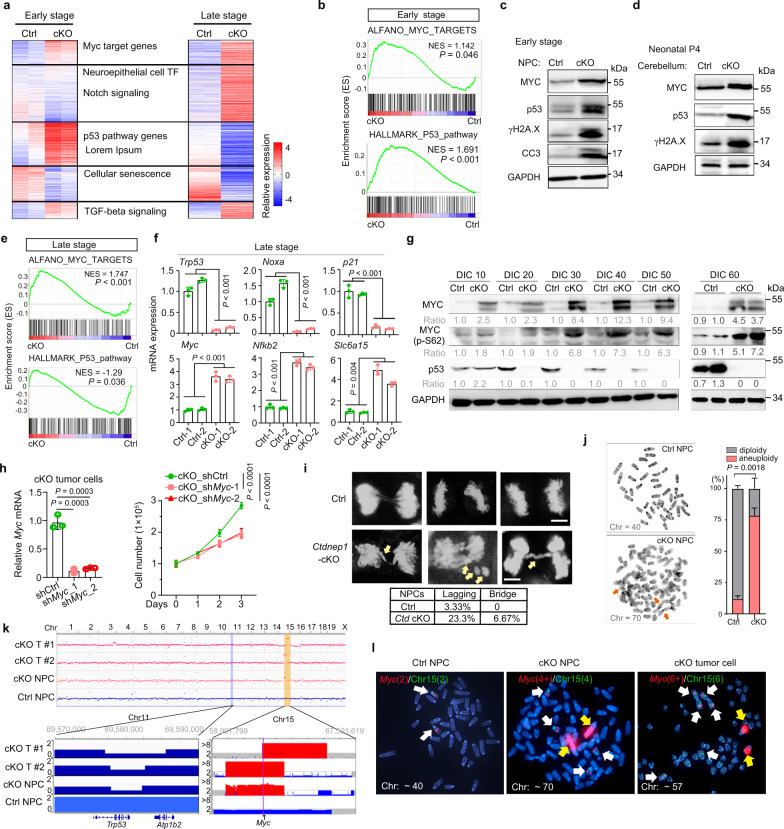
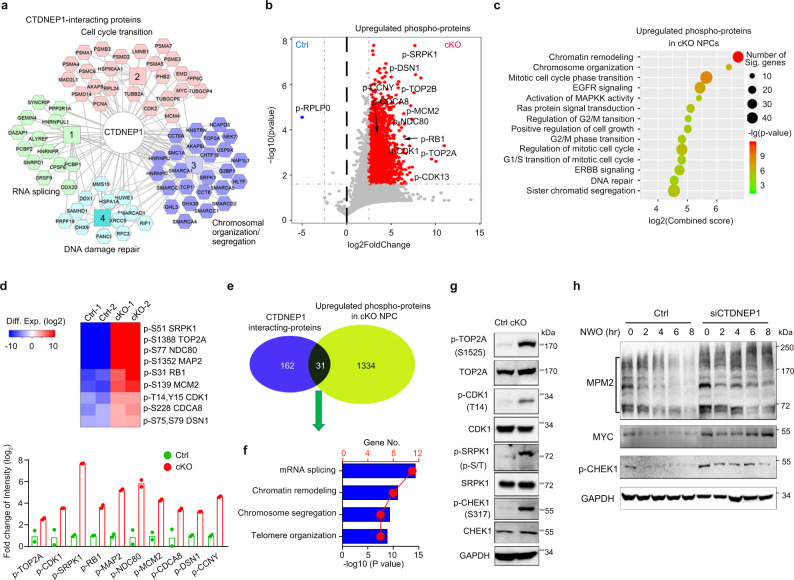
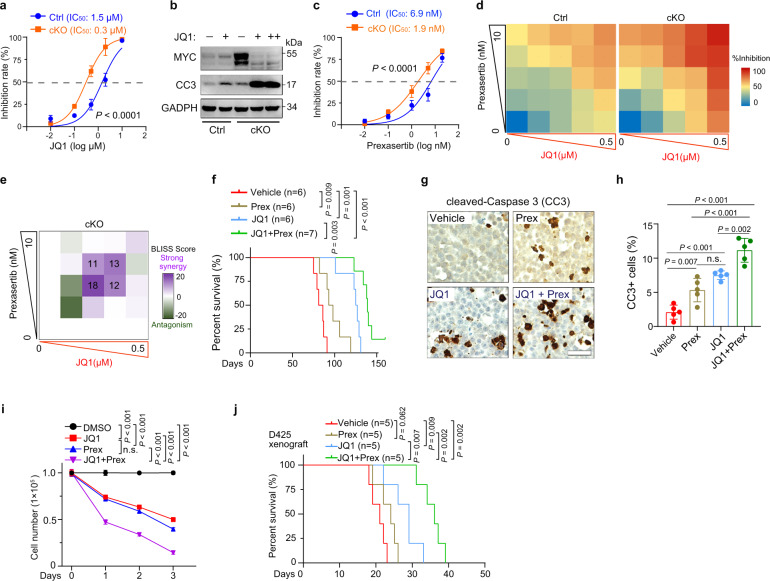
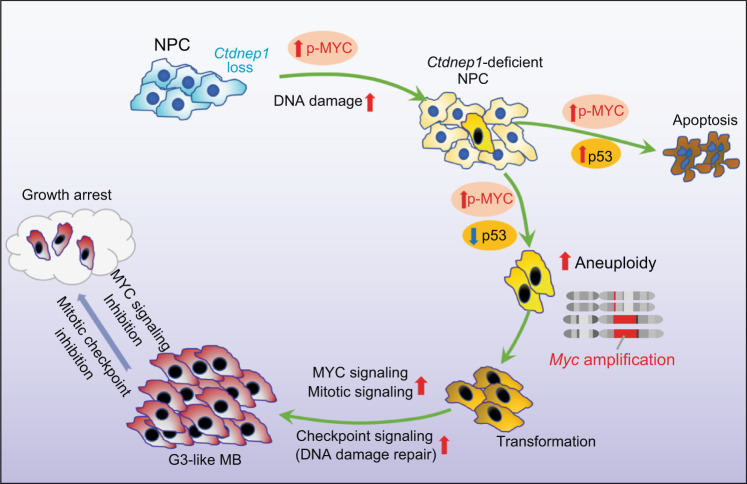
MYC-driven medulloblastomas are highly aggressive childhood brain tumors, however, the molecular and genetic events triggering MYC amplification and malignant transformation remain elusive. Here we report that mutations in CTDNEP1, a CTD nuclear-envelope-phosphatase, are the most significantly enriched recurrent alterations in MYC-driven medulloblastomas, and define high-risk subsets with poorer prognosis. Ctdnep1 ablation promotes the transformation of murine cerebellar progenitors into Myc-amplified medulloblastomas, resembling their human counterparts. CTDNEP1 deficiency stabilizes and activates MYC activity by elevating MYC serine-62 phosphorylation, and triggers chromosomal instability to induce p53 loss and Myc amplifications. Further, phosphoproteomics reveals that CTDNEP1 post-translationally modulates the activities of key regulators for chromosome segregation and mitotic checkpoint regulators including topoisomerase TOP2A and checkpoint kinase CHEK1. Co-targeting MYC and CHEK1 activities synergistically inhibits CTDNEP1-deficient MYC-amplified tumor growth and prolongs animal survival. Together, our studies demonstrate that CTDNEP1 is a tumor suppressor in highly aggressive MYC-driven medulloblastomas by controlling MYC activity and mitotic fidelity, pointing to a CTDNEP1-dependent targetable therapeutic vulnerability.


Conflict of interest statement

The authors declare no competing interests.

Figures

Fig. 1
Fig. 1. Prevalence and clinical impact of recurrent mutations of CTDNEP1 in G3 MBs.
a Frequency of known and recurrent genetic variants in pediatric G3 MBs. b The significance enrichment plot of somatic recurrent mutated genes in G3-MB compared with other MB subgroups. P values were calculated based on Fisher’s exact test and were then adjusted for multiple testing by Bonferroni correction methods. c Frequency of CTDNEP1 LOF variants in different MB subgroups. d Somatic CTDNEP1 mutation profile in patients with MBs. fs, Frameshift. e Association between somatic CTDNEP1 LOF variants and somatic chromosomal alterations (n = 136 G3-MB). p values were calculated using Bayesian logistic regression analysis, likelihood ratio tests, and adjusted for multiple testing based on 5% false discovery rate (FDR) correction. f Kaplan–Meier analysis of overall survival of patients with WNT, SHH, G3, and G4 MB based on the CTDNEP1 high and low expression across subgroups in publicly available MB cohorts. Log-rank test. g Kaplan-Meier analysis of overall survival of patients with CTDNEP1 (CTD) mutation and no MYC amplification (CTD w/o MYC), MYC amplification and no CTDNEP1 mutation (MYC w/o CTD), CTDNEP1 mutation and MYC amplification (CTD + MYC) and other G3 MB patients (other G3). Log-rank test. n.s., not significant. Source data are provided as a Source Data file.
Fig. 2
Fig. 2. Inhibition of CTDNEP1 expression promotes MB cell proliferation.
a qRT-PCR quantification of CTDNEP1 in D425 cells transduced with lentiviral control (shCtrl) and shRNAs targeted against CTDNEP1 (shCTD). n = 3 independent experiments. b Left, representative images of shCtrl and shCTD-transduced D425 cells stained for EdU (scale bar, 50 μm); right, quantification of EdU+ cells. n = 3 independent experiments. c Growth of shCtrl and shCTD-transduced D425 cells assayed by WST-1. n = 6 independent measurements. Two-way ANOVA. d Upper, the number of clones per well in a soft agar assay of Ctrl and shCTD D283 cells after 10 days culture. Lower: representative images of clones in soft agar plates. n = 3 independent experiments. e, f Left: representative images of neurospheres of control and shCTD- transduced D425 (e) and D283 cells (f). Scale bars, 100 μm. Right panels: the number of spheres. n = 3 independent experiments. g, h Representative flow cytometry (g) of cell-cycle stages of D283 (upper) and D425 (lower) cells transduced with shCtrl or shCTD. h percentage of cells at different cell-cycle stages (n = 3 independent experiments), ns: no significance. i, j Left: representative photographs of tumors from mice transplanted subcutaneously with 1 × 106 shCtrl and shCTD-treated D425 (i), or D283 (j) cells. Right: weights of tumors as means ± SD (n = 4 mice per group for i and n = 3 mice for j). k, l Representative hematoxylin/eosin staining of the cerebellum from the mice transplanted with shCtrl and shCTDNEP1-transduced MB-004 cells (k) and their survival curves (l; n = 6 animals/group). Log-rank test. Dash circles indicate the tumor tissues. Scale bars: 1 mm. m Left: Immunoblots of CTDNEP1 overexpression (OE) in D425 cells. Right: cell proliferation as monitored by WST-1 in control and CTD-OE D425 cells. n = 3 independent experiments, two-way ANOVA. n Left: photographs of tumors from mice transplanted subcutaneously with control or CTDNEP1-overexpressing D425 cells. Right: Weights of tumors (n = 4 animals per group). The data are presented as mean values ± SD. Two-tailed Student’s t test for a, b, df, hj, n. Source data are provided as a Source Data file.
Fig. 3
Fig. 3. Loss of CTDNEP1 increases MYC stability and activity.
a Heatmap of differentially expressed genes in D425 cells treated with shCtrl and shCTD. b Volcano plot of transcriptome profiles between control D425 cells and shCTDNEP1 (CTDNEP1-KD) treated cells. Red and blue dots represent genes significantly upregulated and downregulated in cells depleted of CTDNEP1 (p < 0.05, false discovery rate [FDR] < 0.1, two-sided Student’s t test for correction for multiple hypotheses testing), respectively. c Correlations of upregulated genes in shCTDNEP1 D425 cells with MYC expression in G3 MBs. Benjamini-Hochberg method with correction for multiple hypothesis testing of significance. d qRT-PCR quantification of c-MYC mRNA in shCtrl and shCTD-treated D425 cells. n.s., not significant. e Representative immunoblots from 2 independent experiments for total MYC protein and p-S62-MYC in shCtrl and shCTD-treated D425 cells. f Representative immunoblots from 3 independent experiments for total MYC protein and p-S62-MYC in shCtrl and shCTD D425 cells treated with cycloheximide (CHX, 10 μg/ml) for 1 or 3 h. g Conserved residues (red) in the catalytic motif of DXDX(T/V) protein family. h The phosphatase activity of CTDNEP1 wildtype and mutant (D67N, D69N, and L72H) proteins. i Representative immunoblots from 3 independent experiments for flag-tagged c-MYC after treatment by CHX at indicated time points in 293 T cells co-transfected with wildtype (wt) or flag-tagged c-Myc mutant (S62E), and wildtype (wt) or myc-tagged CTDNEP1 mutants (D69N or L72H) as indicated (left). Quantification of c-Myc-flag expression after 4 hr CHX treatment as compared to untreated cells (right). j Representative immunoblots for MYC and p-Ser62 MYC levels in D425 cell lysates after 1 h incubation with wild-type and mutants of HA-tagged CTDNEP1 proteins. k Representative immunoblots for MYC protein and p-S62-MYC in stable CTDNEP1 overexpressing D425 cells. l Representative immunoblots for CTDNEP1 with MYC in D425 cells transduced with control and lentivirus expressing HA-tag-CTDNEP1 after 4-h of MG132 treatment. n = 3 independent experiments in a, e, f, hl. The data are presented as mean values ± SD. Two-tailed Student’s t test for d, h, and i. Source data are provided as a Source Data file.
Fig. 4
Fig. 4. Ctdnep1 ablation in cerebellar NPCs induces G3 MB-like tumor formation.
a Diagram depicting the generation of Ctdnep1-cKO mice. b Left and middle, representative images (left) of Ctdnep1-cKO NPCs (cKO) and control (Ctrl) NPCs at different stages. Right, relative proliferative rates of control and Ctdnep1-cKO NPCs at the different stages of in vitro culture (right). n = 5 independent experiments. Scale bars: 100 μm. c Left: Representative images of EdU stained control and Ctdnep1-cKO NPCs. Scale bar: 100 μm. Right: Percentages of EdU+ cells (n = 5 independent experiments) in Ctdnep1-cKO or WT NPC at late-stage (DIC 60). d Representative bioluminescence imaging of mice transplanted with WT or Ctdnep1-cKO NPCs at 65 days post-transplantation. e Hematoxylin and eosin staining of cerebellum sections with WT or Ctdnep1-cKO NPCs transplantation. Scale bars: 5 mm (upper) and 100 μm (lower). n = 5 independent allografts/group. f Survival curves for animals transplanted with Ctrl and Ctdnep1-cKO NPCs. Log-rank test. g Representative immunostaining and quantification of the labeled cells in tumor and para-tumor regions from Ctdnep1-cKO NPCs transplanted cerebella. Scale bars: 50 μm. n = 3 independent allografts/group; NT, non-tumor region of the samples with tumor; T, tumor tissue. h Heatmap of differentially expressed genes in Ctdnep1-cKO tumors, Ctdnep1-cKO NPCs, and Ctrl NPCs. n = 2 independent samples/group. i Principal component analysis of transcriptomes of Ctdnep1-cKO NPCs (DIC 60) and cKO tumors with mouse SHH (SmoM2 OE and GFAP-cKO Ptch1) and G3 MB (Myc_Gfi1 tumor, Myc/Trp53- Group3 MB, and Sox2+ Myc models and normal cerebella,. j Correlation of transcriptomic profiles of Ctdnep1-cKO NPCs (DIC 60) and cKO tumors with human MB subgroups using MB signature genes. MYCAMP and MYCNA represent MYC amplification and non-amplification G3-MBs, respectively. k, l Genome browser tracks of ATAC-seq signals at the locus of Myc in control NPCs and Ctdnep1-cKO NPCs at DIC 10 (k) or DIC 60 or Ctdnep1-cKO tumor cells (l). Highlights: the promoter/enhancer of Myc. The data are presented as mean values ± SD. Two-tailed Student’s t test for b, c, g. Source data are provided as a Source Data file.
Fig. 5
Fig. 5. Ctdnep1 ablation induces genomic instability and Myc gene amplification.
a Heatmap of differentially expressed genes in Ctdnep1-cKO NPCs (n = 2) compared to wild-type NPCs (Ctrl, n = 2). b GSEA plots of p53 pathway and MYC target genes between control and Ctdnep1-cKO NPCs at the early stage. c, d Representative immunoblots of indicated proteins in the early-stage NPCs (c) and the cerebellum of Ctdnep1-cKO mice at postnatal day 4 (d). e GSEA plots of p53 pathway and MYC target genes between control and Ctdnep1-cKO NPCs at the late-stage. f qRT-PCR quantification of indicated transcripts in control and Ctdnep1-cKO NPCs at late-stage. g Representative immunoblots for MYC and p53 in Ctdnep1-cKO and Ctrl NPCs from the different stages. h Relative Myc expression (left) in Ctdnep1-cKO NPCs transduced with control shRNA or shMyc RNAs. Cell viability (right) of Ctdnep1-cKO NPCs is measured by WST-1 assay. Right: two-way ANOVA. i Anaphase analysis of control and Ctdnep1-cKO NPCs at early stage. Upper: representative images of anaphase cells. Scale bar, 5 μm. Lower: Quantification of cells with lagging or bridged chromosomes (n = 60 anaphase cells each group). j Representative images of karyotype analysis (left) and quantification (right) of control and Ctdnep1-cKO NPCs at DIC 70. Arrows: chromosomal aberrations. k Upper: CNV analysis of Ctrl NPCs and Ctdnep1-cKO NPCs at late-stage (DIC 60), and two independent Ctdnep1-cKO tumor cells (cKO-T) based on 30x WGS analysis. Lower: Red and blue regions represent the focal amplified or deleted segments of the indicated chromosome, respectively. l Representative FISH images showed the Myc gene (Red) and chromosome 15 (Green) in control NPCs at DIC 70 (16/20), Ctdnep1-cKO NPCs (cKO-NPC) at DIC 70 (17/20), and Ctdnep1-cKO tumor cells (14/20). White arrows, the Myc gene in chromosome 15; yellow arrows, Myc gene amplification translocated out of chromosome 15. n = 3 independent experiments in c, d, fh, j. The data are presented as mean values ± SD. GSEA tests in b and e use a standard t test statistic. Two-tailed Student’s t test for f, h, j. Source data are provided as a Source Data file.
Fig. 6
Fig. 6. CTDNEP1 post-translationally modulates the activities of key regulators for chromosome decatenation and mitotic checkpoints.
a CTDNEP1-interating proteins identified by mass spectrographic analysis in 293 T cells which was expressing HA-tag CTDNEP1. b Mass spectroscopy analysis of phosphorylated proteins in Ctdnep1-cKO NPCs (cKO) at DIC 10 compared with Ctrl NPCs. Two-tailed unpaired Student’s t test. c Pathway analysis of the most differentially upregulated phospho-proteins in Ctdnep1-cKO NPCs compared with wild-type NPCs. Fisher exact test. d Upper, representative phosphorylated proteins involved in cell-cycle progression that are enriched in Ctdnep1-cKO NPCs compared to control NPCs. Lower panel; the phosphorylation intensity of mitosis and chromosome segregation proteins in the NPCs detected by mass spectrometry. Data represent means, n = 2 independent experiments. e Venn diagram of CTDNEP1 binding proteins and phospho-proteins enriched in Ctdnep1-cKO NPCs compared to wild-type NPCs. f GO analysis of candidate CTDNEP1 interacting phospho-proteins in Ctdnep1-cKO NPCs. Fisher exact test. g Representative immunoblots from 3 independent experiments for p-TOP2A, p-CDK1, p-SRPK1 and p-CHEK1 in Ctdnep1-cKO and wild-type NPCs at late-stages. h Representative immunoblots from 3 independent experiments for the indicated phospho-proteins in D425 cells transfected with control siRNA or siCTDNEP1 after treatment with nocodazole for 14 h and sampled at indicated time points in fresh medium. NOW; nocodazole washout. Source data are provided as a Source Data file.
Fig. 7
Fig. 7. Combined targeting MYC and CHEK1 activities inhibits CTDNEP1-deficient tumor progression.
a Cell viability of control and Ctdnep1-cKO NPCs treated with the indicated concentrations of JQ1 relative to vehicle-treated cells. Data represent means ± SD, n = 5 independent experiments. b Representative immunoblots from 3 independent experiments for MYC and cleaved Caspase 3 in control or Ctdnep1-cKO NPCs treated with JQ1 (0.5 μM: +; 1 μM: ++) or DMSO (−). c Cell viability of Ctdnep1-cKO NPCs and wild-type NPCs treated with prexasertib (Prex) for 3 days at indicated concentrations relative to vehicle-treated cells. d, e Heatmap showing the percentage of growth inhibition of Ctdnep1-cKO tumors and wild-type NPCs by combined treatment with JQ1 and prexasertib relative to vehicle-treated cells (d); Bliss score for JQ1 and prexasertib double titrations (e). n = 5 independent experiments. f Kaplan-Meier survival for Ctdnep1-cKO tumor-bearing allografts treated with vehicle, JQ1, prexasertib, or JQ1 and prexasertib combined treatment once/day for 2-weeks after transplantation at day 45. Log rank test. g Representative images of immunostaining for cleaved-Caspase 3 (CC3) in vehicle, JQ1, prexasertib, or JQ1 and prexasertib combined treated mice with Ctdnep1-cKO tumors 62 days after implantation. Red arrows CC3+ cells in the tumor section. h quantification of CC3+ cells in the tumor tissues of the indicated treatment groups. Scale bars: 50 μm. Data are means ± SD. n = 3 allografts; two-tailed Student’s t test. i Viability of D425 cells treated with JQ1 (1 μM), prexasertib (10 nM), or the combination relative to vehicle-treated cells. j Kaplan-Meier survival for MYC-driven D425 orthotopic xenografts treated with vehicle, JQ1, prexasertib or JQ1, and prexasertib once/day for 2-weeks after transplantation at day 10. Log-rank test. n = 5 independent experiments for f, h, and j. n = 3 independent experiments in c, d, fh, and j. The data are presented as mean values ± SD; Two-way ANOVA for a, c, and i; two-tailed Student’s t test for f, h, j. Source data are provided as a Source Data file.
Fig. 8
Fig. 8. A schematic model for G3 MB transformation induced by CTDNEP1-deficiency.
CTDNEP1 depletion or mutation in neural stem/progenitor cells (NPCs) results in MYC activation along with DNA damage and increased p53 levels, leading to apoptosis at the early stages. However, a population of CTDNEP1-deficient NPCs acquires the selective fitness advantage to survive by inducing p53 loss or downregulation and triggers genomic instability and aneuploidy with Myc gene amplifications. Together with p53 loss and Myc amplification, the increased CHEK1-mediated DNA damage repair and mitotic checkpoint signaling further contributes to the transformation of CTDNEP1-deficient NPCs into malignant G3-like MBs. Targeting MYC and mitotic checkpoint signaling with JQ1 and prexasertib, respectively, inhibits the growth of the CTDNEP1-deficient G3-like MBs.

Similar articles

Cited by

References

    1. Liu KW, Pajtler KW, Worst BC, Pfister SM, Wechsler-Reya RJ. Molecular mechanisms and therapeutic targets in pediatric brain tumors. Sci. Signal. 2017;10:eaaf7593. - PubMed
    1. Taylor MD, et al. Molecular subgroups of medulloblastoma: the current consensus. Acta neuropathologica. 2012;123:465–472. - PMC - PubMed
    1. Cavalli FMG, et al. Intertumoral Heterogeneity within Medulloblastoma Subgroups. Cancer Cell. 2017;31:737–754.e736. - PMC - PubMed
    1. Northcott PA, et al. The whole-genome landscape of medulloblastoma subtypes. Nature. 2017;547:311–317. - PMC - PubMed
    1. Robinson G, et al. Novel mutations target distinct subgroups of medulloblastoma. Nature. 2012;488:43–48. - PMC - PubMed

Publication types

Substances