. 2023 Feb 10;14(1):746.
doi: 10.1038/s41467-023-36334-1.

Long-term platinum-based drug accumulation in cancer-associated fibroblasts promotes colorectal cancer progression and resistance to therapy

Affiliations

Long-term platinum-based drug accumulation in cancer-associated fibroblasts promotes colorectal cancer progression and resistance to therapy

Jenniffer Linares et al. Nat Commun. .

Abstract

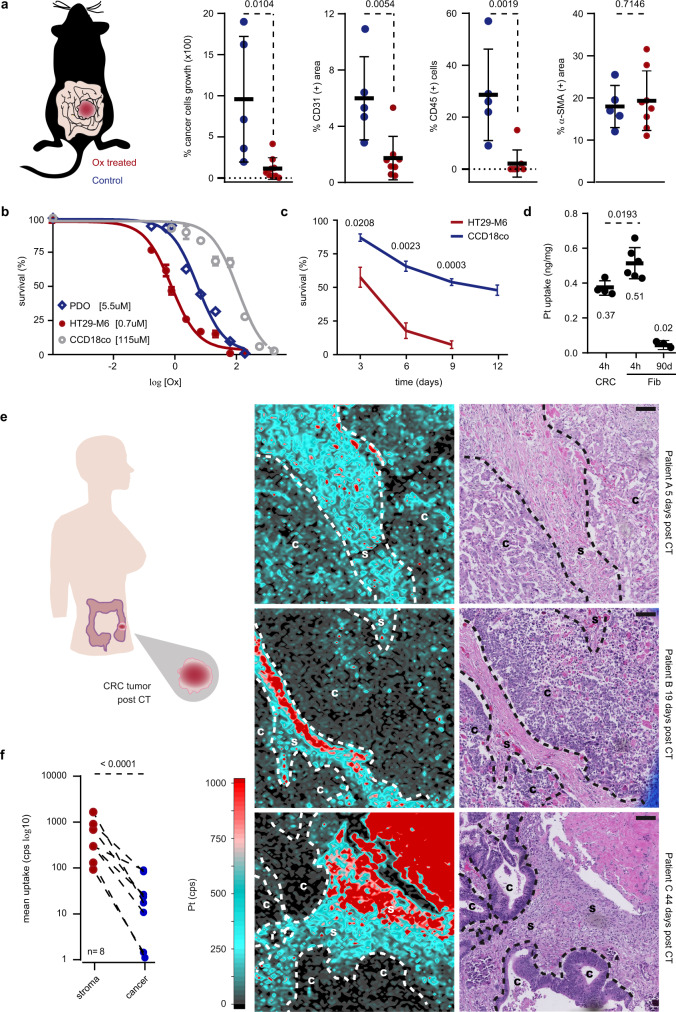
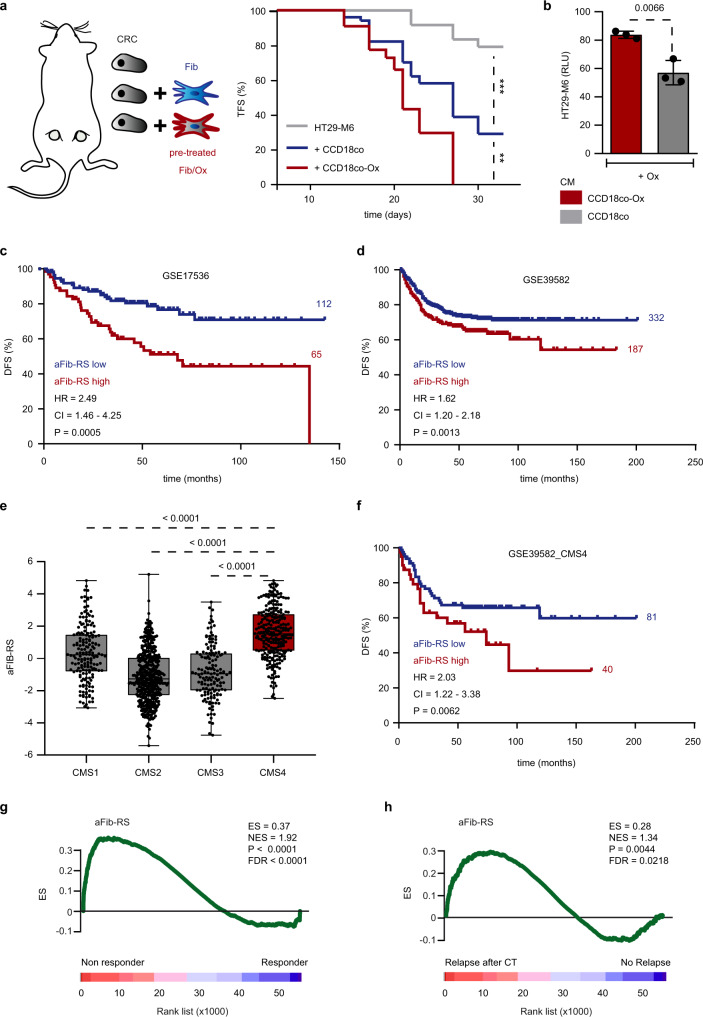
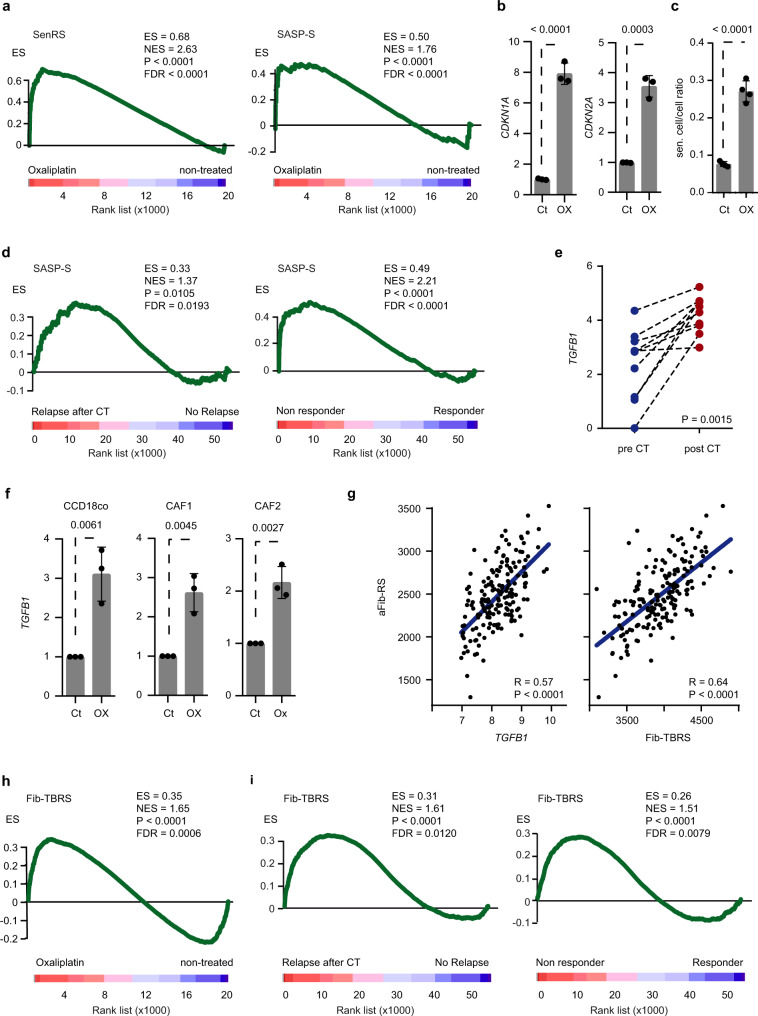
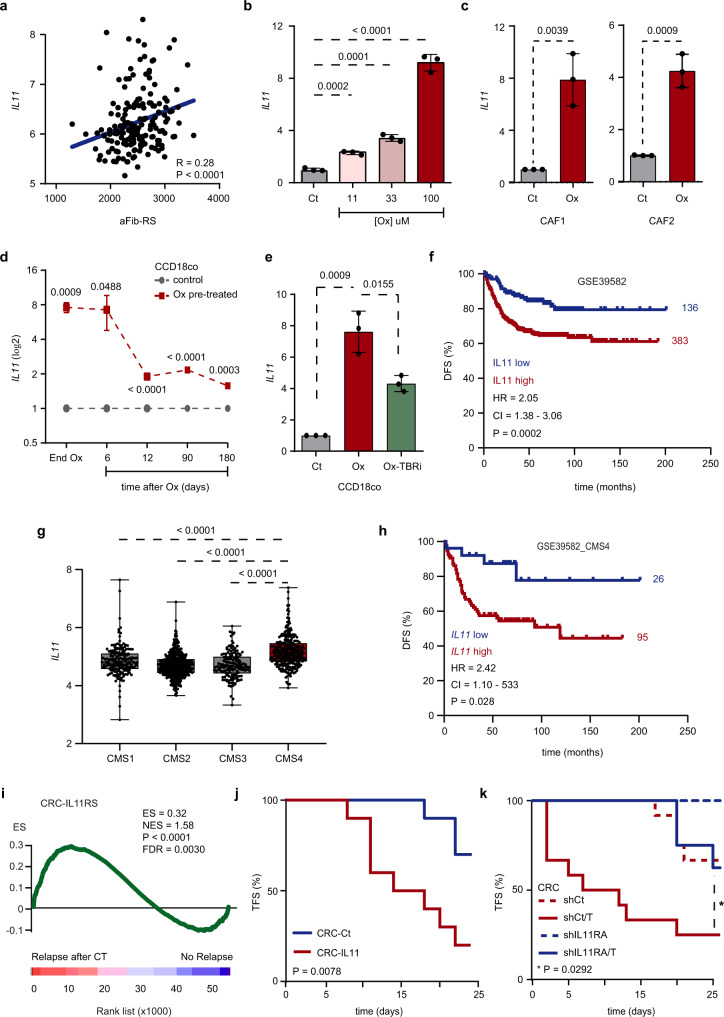
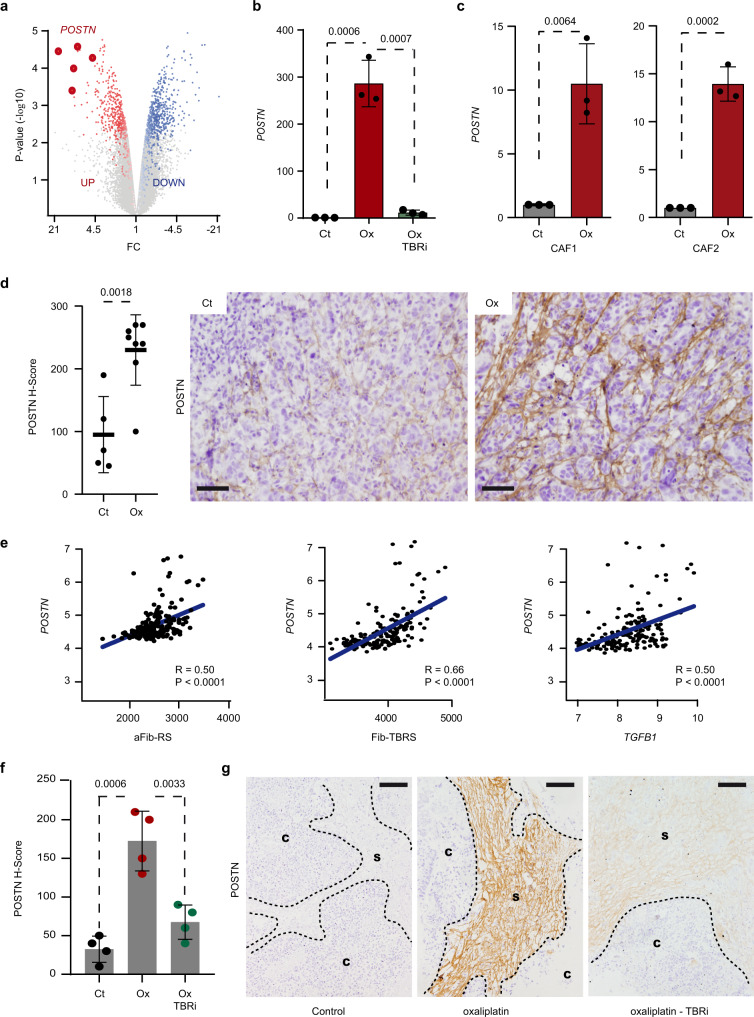
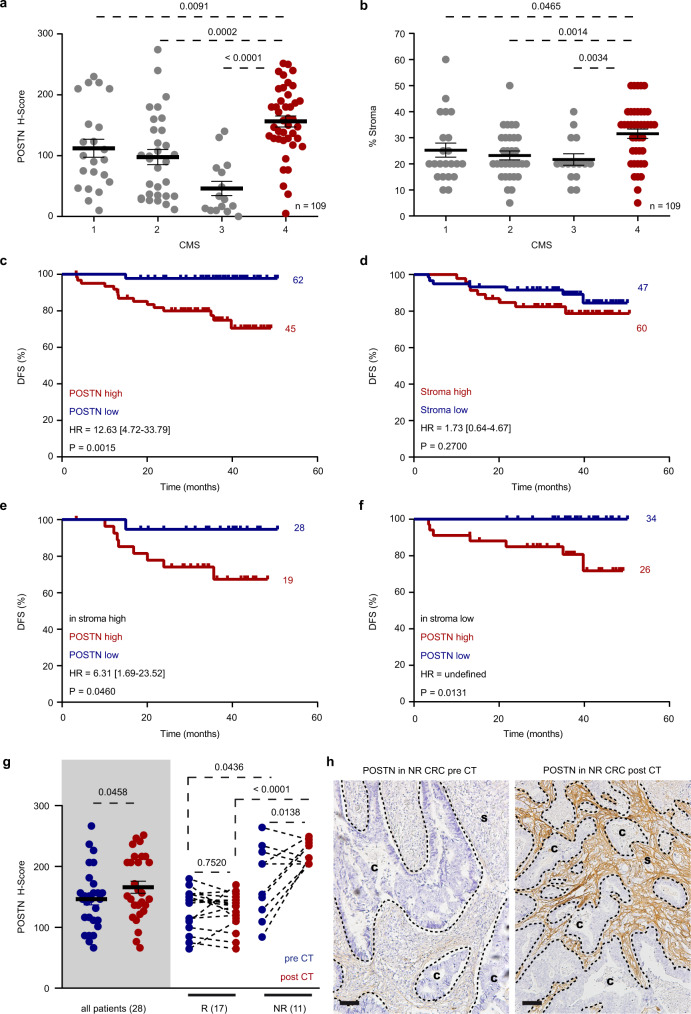
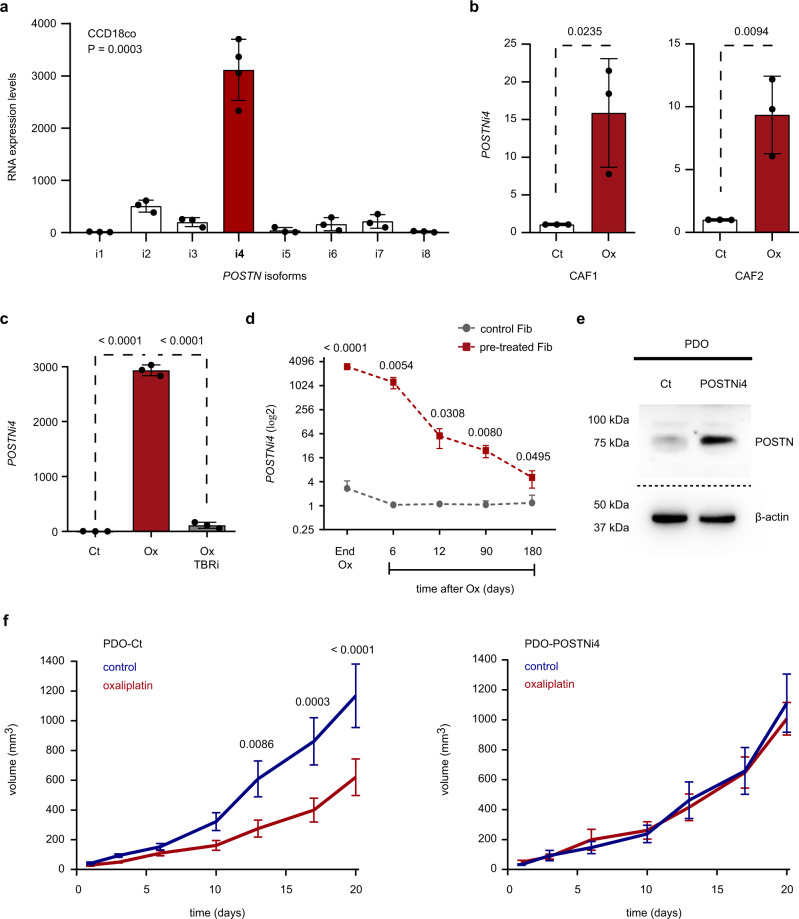
A substantial proportion of cancer patients do not benefit from platinum-based chemotherapy (CT) due to the emergence of drug resistance. Here, we apply elemental imaging to the mapping of CT biodistribution after therapy in residual colorectal cancer and achieve a comprehensive analysis of the genetic program induced by oxaliplatin-based CT in the tumor microenvironment. We show that oxaliplatin is largely retained by cancer-associated fibroblasts (CAFs) long time after the treatment ceased. We determine that CT accumulation in CAFs intensifies TGF-beta activity, leading to the production of multiple factors enhancing cancer aggressiveness. We establish periostin as a stromal marker of chemotherapeutic activity intrinsically upregulated in consensus molecular subtype 4 (CMS4) tumors and highly expressed before and/or after treatment in patients unresponsive to therapy. Collectively, our study underscores the ability of CT-retaining CAFs to support cancer progression and resistance to treatment.


Conflict of interest statement

A.Ce. declares institutional research funding from Genentech, Merck Serono, Bristol Myers Squibb, Merck Sharp & Dohme, Roche, Beigene, Bayer, Servier, Lilly, Novartis, Takeda, Astellas, Takeda and Fibrogen; and advisory board or speaker fees from Amgen, Merck Serono, Roche, Bayer, Servier and Pierre Fabre in the last 5 years. J.T. reports personal financial interest in form of scientific consultancy role for Array Biopharma, AstraZeneca, Bayer, Boehringer Ingelheim, Chugai, Daiichi Sankyo, F. Hoffmann-La Roche Ltd, Genentech Inc, HalioDX SAS, Hutchison MediPharma International, Ikena Oncology, Inspirna Inc, IQVIA, Lilly, Menarini, Merck Serono, Merus, MSD, Mirati, Neophore, Novartis, Ona Therapeutics, Orion Biotechnology, Peptomyc, Pfizer, Pierre Fabre, Samsung Bioepis, Sanofi, Scandion Oncology, Scorpion Therapeutics, Seattle Genetics, Servier, Sotio Biotech, Taiho, Tessa Therapeutics and TheraMyc. Stocks: Oniria Therapeutics and also educational collaboration with Imedex/HMP, Medscape Education, MJH Life Sciences, PeerView Institute for Medical Education and Physicians Education Resource (PER). N.T. declares the following: Advisory Role: Merck Serono, Guardant Health, Speaking: Amgen, Servier, Pfizer, Merck Serono, ESMO, SEOM. C.M. reports personal financial interest in form of scientific consultancy role for Amgen, Biocartis, F. Hoffmann-La Roche Ltd, Genentech Inc, Merck Serono, Pfizer, Pierre Fabre, Sanofi, also educational collaboration with Amgen, Guardant Health, Merck Serono. The remaining authors declare no other competing interests.

Figures

Fig. 1
Fig. 1. Platinum accumulates within fibroblasts resilient to treatment.
a Tumor analysis in MTO-injected C57BL/6J mice treated with oxaliplatin. Left panel: percentage of tumor growth upon treatment. Right panels: percentage of CD31, CD45 and α-SMA intratumoral positivity. Control (blue; n = 5) and treated conditions (red; n = 8). Values are mean ± sd. p values are indicated. Drawing modified from Tauriello et al.. b Biological activity of oxaliplatin against HT29-M6, PDO and CCD-18Co. Values are mean ± sd. EC50 are indicated. Representative of n = 3 biologically independent experiments. c 12-days follow-up of HT29-M6 and CCD-18Co cells survival upon oxaliplatin treatment. n = 3 biologically independent experiments. Values are mean ± sd. p value is indicated. d Oxaliplatin uptake in HT29-M6 (CRC) after 4 h treatment and in CCD-18Co (Fib) after 4 h treatment and 90 days after treatment. n = 6 biologically independent experiments. Mean quantities ± sd and p value are indicated. e Oxaliplatin biodistribution representative of eight independent patient tumors resected after CT. Time post CT is indicated. Left panels: platinum (Pt) uptake map. Right panels: corresponding hematoxylin and eosin staining, Scale bars: 100 μm. Drawing modified from Rivas, Linares et al.. f Mean stromal (red) and cancer (blue) Pt uptake in samples from eight CRC patients. p value is indicated. PDO patient-derived tumor organoids, C cancer, S stroma, CT chemotherapy, cps count per second. Two-sided, unpaired (a, c, d) and paired (f) t-test p values (p) are indicated. Source data are provided as a Source Data file.
Fig. 2
Fig. 2. Platinum-stimulated fibroblasts promote CRC progression.
a Kaplan–Meier plot displays tumor initiation overtime in nude mice injected subcutaneously with 15,000 HT29-M6 cells alone (gray; n = 24), co-injected with 50,000 CCD-18Co non-treated (blue; n = 50) or pre-treated with oxaliplatin (red; n = 44). **p = 0.0015, ***p = 0.0002. Drawing modified from Calon et al.. b Quantitative analysis of oxaliplatin-treated HT29-M6 cells cultured with conditioned media (CM) from CCD-18Co non-treated or pre-treated with oxaliplatin. n = 3 biologically independent experiments. Values are mean ± sd. p value is indicated. c Kaplan–Meier curve displays DFS for GSE17536 patients (n = 177) presenting low (blue; n = 112) or high expression levels of aFib-RS (red; n = 65). HR, CI, p value are indicated. d Kaplan–Meier curve displays DFS for GSE39582 patients (n = 519) presenting low (blue; n = 332) or high expression levels of aFib-RS (red; n = 187). HR, CI, p value are indicated. e aFib-RS levels in n = 1029 CRC patients classified by CMS subtypes (CMS1 n = 175; CMS2 n = 445; CMS3 n = 147, CMS4 n = 262). Central mark indicates the median, box extends from the 25th to 75th percentiles, whiskers represent the maximum and minimum data point. p values are indicated. f Kaplan–Meier curve displays DFS for GSE39582_CMS4 patients (n = 121) presenting low (blue; n = 81) or high expression levels of aFib-RS (red; n = 40). HR, CI, p value are indicated. g GSEA of aFib-RS in the GSE72970 subset of tumor samples collected before treatment comparing patients responding to CT (n = 20) and unresponsive (n = 12) patients. h GSEA of aFib-RS in the GSE14333 subset of tumor samples collected before treatment comparing relapsing (n = 13) to non-relapsing (n = 38) patients after CT. ES enrichment score, NES normalized enrichment score, FDR false discovery rate. TFS tumor-free survival, CRC colorectal cell line (HT29-M6). Fib fibroblasts (CCD-18Co), DFS disease-free survival, HR hazard ratio, CI confidence interval, Ox oxaliplatin, GSEA gene set enrichment analysis, RLU relative luminescence unit. Two-sided, unpaired t-test p values (p) are indicated for b, e. Log-rank (Mantel–Cox test) p values (p) are indicated for a, c, d, f. GSEA nominal p value (p) and FDR-adjusted p value are indicated for g, h. Source data are provided as a Source Data file.
Fig. 3
Fig. 3. Platinum absorption increases TGF-beta activity in fibroblasts.
a GSEA of SenRS (left panel) and SASP-S (right panel) comparing oxaliplatin treated (n = 2) and non-treated (n = 2) CCD-18Co in culture. b Relative expression levels of CDKN1A and CDKN2A in CCD-18Co treated with oxaliplatin. n = 3 biologically independent experiments. Values are mean ± sd. p values are indicated. c β-galactosidase positive CCD-18Co quantification after oxaliplatin treatment. n = 4 biologically independent experiments. Values are mean ± sd. p value is indicated. d GSEA of SASP-S comparing relapsing (n = 13) to non-relapsing (n = 38) patients after CT (GSE14333; left panel) and comparing patients responding to CT (n = 20) to unresponsive (n = 12) patients (GSE72970; right panel). e Relative expression levels of TGFB1 in paired tumor samples from ten CRC patients before and after platinum-based CT. p value is indicated. f Relative expression levels of TGFB1 in CCD-18Co, CAF1 and CAF2 treated with oxaliplatin. n = 3 biologically independent experiments. Values are mean ± sd. p values are indicated. g Correlation between aFib-RS and Fib-TBRS or TGFB1 in n = 177 CRC tumors from GSE17536. Correlation values (R) and Spearman p values are indicated. h GSEA of Fib-TBRS comparing oxaliplatin treated (n = 2) and non-treated (n = 2) fibroblasts. i GSEA of Fib-TBRS comparing relapsing (n = 13) to non-relapsing (n = 38) patients after CT (GSE14333; left panel) and comparing patients responding to CT (n = 20) to unresponsive (n = 12) patients (GSE72970; right panel) GSEA gene set enrichment analysis, ES enrichment score, NES normalized enrichment score, FDR false discovery rate, CT chemotherapy, Ox oxaliplatin, Ct control. Two-sided, unpaired (b, c, f) and paired (e) t-test p values (p) are indicated. GSEA nominal p value (p) and FDR-adjusted p value are indicated for a, d, h, i. Source data are provided as a Source Data file.
Fig. 4
Fig. 4. TGF-beta pathway autocrine activation in platinum-stimulated fibroblasts upregulates IL11 secretion.
a Correlation between IL11 and aFib-RS in n = 177 CRC tumors from GSE17536. Correlation (R) and Spearman p value are indicated. b Relative expression levels of IL11 in CCD-18Co treated with increasing concentration of oxaliplatin. n = 3 biologically independent experiments. Values are mean ± sd. p values are indicated. c Relative expression levels of IL11 in CAF1 and CAF2 treated with oxaliplatin. n = 3 biologically independent experiments. Values are mean ± sd. p values are indicated. d Relative expression levels of IL11 in CCD-18Co 6, 12, 90 and 180 days after oxaliplatin retrieval. n = 3 biologically independent experiments. Values are mean ± sd. p values are indicated. e Relative expression levels of IL11 in CCD-18Co treated with oxaliplatin w/o TGF-beta pathway inhibitor (TBRi). n = 3 biologically independent experiments. Values are mean ± sd. p values are indicated. f Kaplan–Meier curve displays DFS for GSE39582 patients presenting low (blue; n = 136) or high (red; n = 383) expression levels of IL11. HR, CI and p value are indicated. g IL11 levels in n = 1029 CRC patients classified by CMS subtypes (CMS1 n = 175; CMS2 n = 445; CMS3 n = 147, CMS4 n = 262). Central mark indicates the median, box extends from the 25th to 75th percentiles, whiskers represent the maximum and minimum data point. p values are indicated. h Kaplan–Meier curve displays DFS for GSE39582_CMS4 patients presenting low (blue; n = 26) or high (red; n = 95) expression levels of IL11. HR, CI and p value are indicated. i GSEA of CRC-IL11RS comparing relapsing (n = 13) to non-relapsing (n = 38) patients after CT in GSE14333. j Kaplan–Meier plot displays tumor initiation overtime in nude mice injected subcutaneously with 30,000 HT29-M6 control (blue; n = 10) or IL11-secreting cells (red; n = 10). p value is indicated. k Kaplan–Meier plot displays tumor initiation overtime in nude mice injected subcutaneously with 30,000 HT29-M6 control cells (dashed red; n = 12), TGF-beta secreting cells (red; n = 12), shIL11RA cells (dashed blue; n = 8) or with shIL11RA/TGF-beta-secreting cells (blue; n = 8). p value is indicated. CRC: HT29-M6; TFS tumor-free survival, DFS disease-free survival, HR hazard ratio, CI confidence interval, Ox oxaliplatin, Ct control, CT chemotherapy. Two-sided, unpaired t-test p values (p) are indicated for be, g. Log-rank (Mantel–Cox test) p values (p) are indicated for f, h, j, k. GSEA nominal p value (p) and FDR-adjusted p value are indicated for i. Source data are provided as a Source Data file.
Fig. 5
Fig. 5. POSTN is marker of platinum-induced TGF-beta activity in CAFs.
a Volcano plot displays genes upregulated and downregulated in fibroblasts treated with oxaliplatin (n = 2) compared to untreated ones (n = 2). X axis is the linear fold change and Y axis the −log10 p value of the ANOVA p values between conditions. POSTN probes are indicated. b Relative expression levels of POSTN in CCD-18Co treated with oxaliplatin w/o TGF-beta pathway inhibitor (TBRi). n = 3 biologically independent experiments. Values are mean ± sd. p values are indicated. c Relative expression levels of POSTN in CAF1 and CAF2 treated with oxaliplatin. n = 3 biologically independent experiments. Values are mean ± sd. p values are indicated. d Left panel: POSTN protein expression levels in tumors from MTO-injected mice treated with oxaliplatin (n = 8) compared to untreated control (n = 5). Values are mean ± sd. p value is indicated. Middle and right panels: representative pictures of POSTN stained tumor sections. Scale bar: 50 μm. e Correlation between POSTN and aFib-RS (left panel), Fib-TBRS (center panel) or TGFB1 (right panel) in n = 177 CRC tumors from GSE17536. Correlation values (R) and Spearman p values are indicated. f POSTN protein expression intensity in tumor samples obtained from untreated patients and cultured ex vivo with oxaliplatin in presence or absence of TGF-beta pathway inhibitor (TBRi). n = 4 biologically independent experiments. Values are mean ± sd. p values are indicated. g Representative POSTN immunostaining in explants from f. Scale bars: 100 μm. IU intensity unit, C cancer, S stroma, Ct control, Ox oxaliplatin. Two-sided, unpaired t-test p values (p) are indicated for bd, f. Source data are provided as a Source Data file.
Fig. 6
Fig. 6. POSTN is a stromal marker of resistance to chemotherapy.
a POSTN protein expression intensity in IHC-CRC cohort (CMS1 n = 22; CMS2 n = 31; CMS3 n = 15, CMS4 n = 41). Values are mean ± sem. p values are indicated. b Percentage of stroma in IHC-CRC cohort (CMS1 n = 22; CMS2 n = 31; CMS3 n = 15, CMS4 n = 41). Values are mean ± sem. p values are indicated. c Kaplan–Meier curve displays DFS of CRC patients in IHC-CRC cohort presenting low (blue; n = 62) or high (red; n = 45) protein expression of POSTN. HR, [CI], p value are indicated. d Kaplan–Meier curve displays DFS of CRC patients in IHC-CRC cohort presenting low (blue; n = 47) or high (red; n = 60) stromal content. HR, [CI], p value are indicated. e Kaplan–Meier curve displays DFS of CRC patients in IHC-CRC cohort presenting low (blue; n = 28) or high (red; n = 19) protein expression of POSTN in tumors with high stromal content. HR, [CI], p value are indicated. f Kaplan–Meier curve displays DFS of CRC patients in IHC-CRC cohort presenting low (blue; n = 34) or high (red; n = 26) protein expression of POSTN in tumors with low stromal content. HR, [CI], p value are indicated. g Left gray panel: protein expression levels of POSTN in all (n = 28) paired tumor samples collected before (blue) and after (red) CT. Right panel: protein expression levels of POSTN in tumor samples categorized by patients responsive (R; n = 17) and unresponsive (NR; n = 11) to therapy. Values are mean ± sem. p values are indicated. h POSTN detection by IHC in paired tumor samples from a NR patient collected before (left panel) and after CT (right panel), representative of n = 11 patients. Scale bars: 100 μm. IU intensity unit, C cancer, S stroma, CMS consensus molecular subtype, CT chemotherapy, HR hazard ratio, CI confidence interval, NR unresponsive to CT, R responsive to CT, DFS disease-free survival. Two-sided, unpaired (a, b) and paired (g) t-test p values (p) are indicated. Log-rank (Mantel–Cox test) p values (p) are indicated for cf. Source data are provided as a Source Data file.
Fig. 7
Fig. 7. Platinum-induced expression of POSTN isoform 4 in the tumor stroma enhances resistance to treatment.
a Relative expression levels of POSTN isoforms in CCD-18Co treated with oxaliplatin. n = 4 and n = 3 biologically independent experiments for POSTNi4 and for POSTNi1-3, 5-8 respectively. Values are mean ± sd. p value is indicated. b Relative expression levels of POSTNi4 in CAFs treated with oxaliplatin. n = 3 biologically independent experiments. Values are mean ± sd. p values are indicated. c Relative expression levels of POSTNi4 in CCD-18Co treated with oxaliplatin w/o TGF-beta pathway inhibitor (TBRi). n = 3 biologically independent experiments. Values are mean ± sd. p values are indicated. d Relative expression levels of POSTNi4 in CCD-18Co 6, 12, 90, 180 days after oxaliplatin retrieval. n = 3 biologically independent experiments. Values are mean ± sd. p value is indicated. e POSTN protein levels in genetically engineered PDOs with upregulated expression of POSTNi4 compared to control cells. Bottom panel shows β-Actin protein levels as normalization control. Representative of n = 3 biologically independent experiments. f Growth kinetics upon oxaliplatin treatment of tumors derived from subcutaneous injection into NSG mice of PDOs-Ct or POSTNi4-secreting PDOs. Left panel: PDOs-Ct injected mice tumors treated (red; n = 10) or non-treated tumors (blue; n = 9). Right panel: POSTNi4-PDOs injected mice tumors treated with oxaliplatin (red; n = 9) or non-treated tumors (blue; n = 7). Values are mean ± sem. p values are indicated. PDO patient-derived tumor organoids, Fib CCD-18Co, Ct control, Ox oxaliplatin. Two-sided, unpaired t-test p values (p) are indicated for ad, f. Source data are provided as a Source Data file.

References

    1. Rottenberg S, Disler C, Perego P. The rediscovery of platinum-based cancer therapy. Nat. Rev. Cancer. 2020;211:37–50. - PubMed
    1. Thiabaud G, et al. Oxaliplatin Pt(IV) prodrugs conjugated to gadolinium-texaphyrin as potential antitumor agents. Proc. Natl Acad. Sci. 2020;117:7021–7029. - PMC - PubMed
    1. Schmoll HJ, et al. Effect of adjuvant capecitabine or fluorouracil, with or without oxaliplatin, on survival outcomes in stage III colon cancer and the effect of oxaliplatin on post-relapse survival: a pooled analysis of individual patient data from four randomised controlled trials. Lancet Oncol. 2014;15:1481–1492. - PMC - PubMed
    1. Cunningham D, et al. Colorectal cancer. Lancet. 2010;375:1030–1047. - PubMed
    1. Hammond WA, Swaika A, Mody K. Pharmacologic resistance in colorectal cancer: a review. Ther. Adv. Med. Oncol. 2016;8:57–84. - PMC - PubMed

Publication types

MeSH terms