. 2023 Feb 10;14(1):765.
doi: 10.1038/s41467-023-36129-4.

Silver lining to a climate crisis in multiple prospects for alleviating crop waterlogging under future climates

Affiliations

Silver lining to a climate crisis in multiple prospects for alleviating crop waterlogging under future climates

Ke Liu et al. Nat Commun. .

Abstract

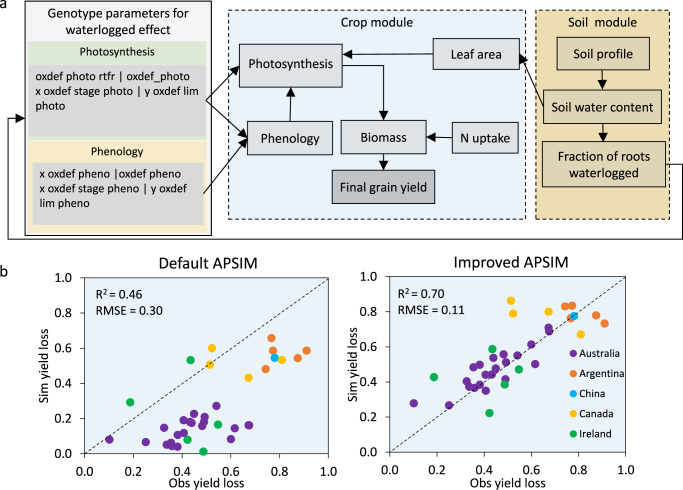
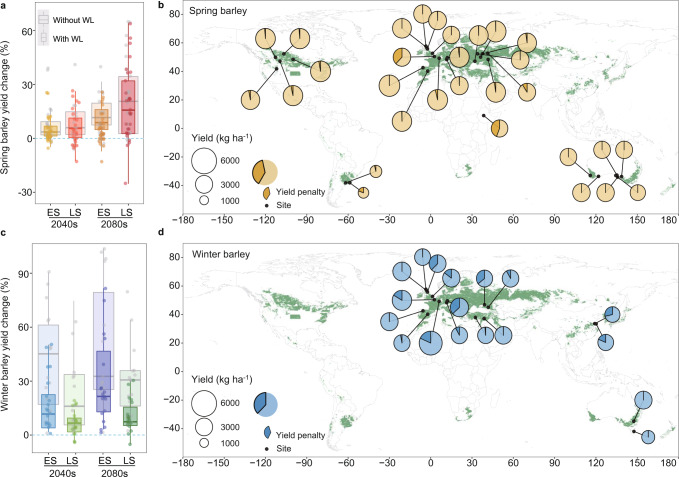
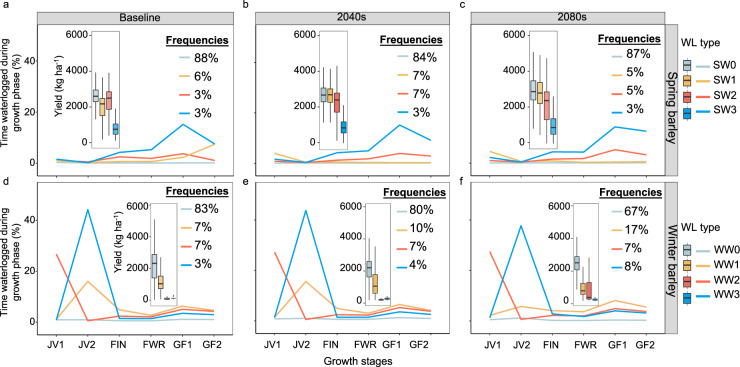
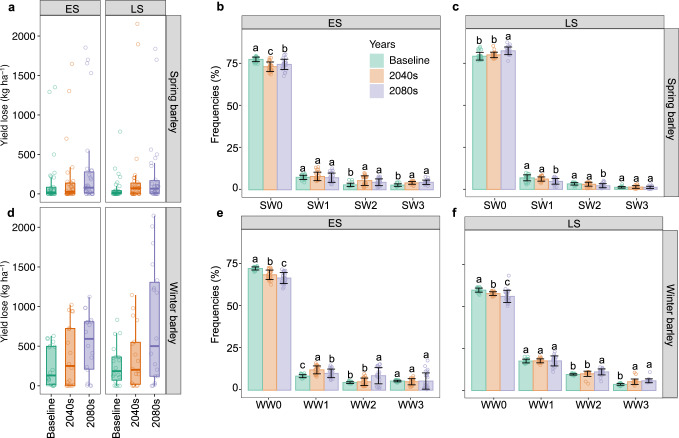
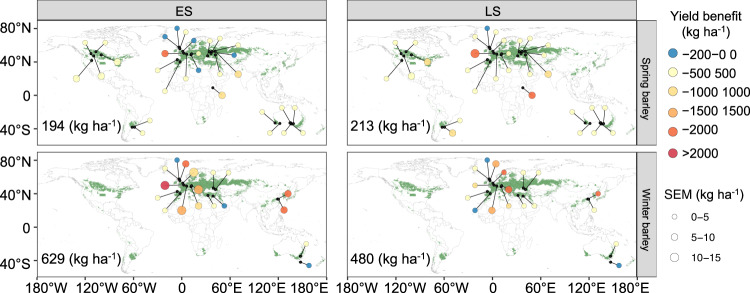
Extreme weather events threaten food security, yet global assessments of impacts caused by crop waterlogging are rare. Here we first develop a paradigm that distils common stress patterns across environments, genotypes and climate horizons. Second, we embed improved process-based understanding into a farming systems model to discern changes in global crop waterlogging under future climates. Third, we develop avenues for adapting cropping systems to waterlogging contextualised by environment. We find that yield penalties caused by waterlogging increase from 3-11% historically to 10-20% by 2080, with penalties reflecting a trade-off between the duration of waterlogging and the timing of waterlogging relative to crop stage. We document greater potential for waterlogging-tolerant genotypes in environments with longer temperate growing seasons (e.g., UK, France, Russia, China), compared with environments with higher annualised ratios of evapotranspiration to precipitation (e.g., Australia). Under future climates, altering sowing time and adoption of waterlogging-tolerant genotypes reduces yield penalties by 18%, while earlier sowing of winter genotypes alleviates waterlogging by 8%. We highlight the serendipitous outcome wherein waterlogging stress patterns under present conditions are likely to be similar to those in the future, suggesting that adaptations for future climates could be designed using stress patterns realised today.


Conflict of interest statement

The authors declare no competing interests.

Figures

Fig. 1
Fig. 1. Framework invoked for modelling waterlogging (WL) stress, including conceptual design of crop physiological responses to waterlogging and model evaluation before (default) and after (improved) modification.
a Schematic of genotypic traits influenced by waterlogging and linkage with existing soil and water sub-models in APSIM. b Comparison of observed (Obs) and simulated (Sim) waterlogged yield loss compared with controls across environments simulated by improved and default versions of APSIM. Data in (b) represent contemporary barley genotypes with varying waterlogging tolerance (n = 36). Parameter descriptions are provided in Supplementary Table 4.
Fig. 2
Fig. 2. Impacts of waterlogging on yield under future climates (2040, 2080) relative to the historical baseline (1985–2016) for early and late sowing (ES, LS).
a, c Simulated yield differences under future climates with and without waterlogging (WL) for genotypes with early (spring sowing barley) or late maturity (autumn/winter sowing barley). b, d Simulated yields (pie charts; dark segments denote yield penalty) under late sowing for spring barley and early sowing for winter barley in 2040 (results for early or late sowing in 2040 and 2080 can be found in supplementary Fig. 12). Yields were simulated with APSIM using downscaled projections from 27 GCMs (n = 27). Boxplots indicate simulated yield change across sites and GCMs; box boundaries indicate 25th and 75th percentiles, whiskers below and above each box denote the 10th and 90th percentiles, respectively. Green regions in the maps define predominant barley cropping areas. The map was modified using R package ggplot2’maps (version 3.4.0)’ with the Natural Earth dataset in a publica domain (https://www.naturalearthdata.com).
Fig. 3
Fig. 3. Waterlogging (WL) stress patterns and frequencies and grain yields for the baseline (1985–2016), 2040 (2030–2059) and 2080 (2070–2099).
Data shown for spring (ac) and winter barley (df) across sites, sowing times and genotypes. Four key waterlogging stress patterns across sites and genotypes are depicted: stress patterns for spring barley include SW0 (minimal waterlogging); SW1 (low moderate-late waterlogging); SW2 (late-onset moderate waterlogging); SW3 (late-onset severe waterlogging) and winter barley WW0 (minimal waterlogging); WW1 (low early-onset waterlogging relieved later); WW2 (moderate early-onset waterlogging); WW3 (severe early-onset waterlogging). Boxplots indicate grain yields for spring and winter barley across sites and GCMs; box boundaries indicate the 25th and 75th percentiles across 27 GCMs, whiskers below and above the box indicate the 10th and 90th percentiles. Growth stages include the early juvenile phase (JV1, 10 <= APSIM growth stage <21; late juvenile phase (JV2, 21 <= APSIM growth stage <32); floral initiation to heading (FIN, 32 <= APSIM growth stage <65); flowering to grain filling (FIN, 65 <= APSIM growth stage <71; early grain filling (GF1, 71 <= APSIM growth stage <80) and late grain filling (GF2, 80 <= APSIM growth stage <87).
Fig. 4
Fig. 4. Grain yield penalty and waterlogging stress patterns for the baseline (1985–2016), 2040 (2030–2059) and 2080 (2070–2099).
Grain yield penalties are shown for spring (a) and winter (d) barley across sites and genotypes for relatively early or late sowing (ES, LS) at each site. Boxplots indicate yield penalty for spring and winter barley across sites and GCMs (n = 27); box boundaries indicate 25th and 75th percentiles, whiskers below and above the box indicate the 10th and 90th percentiles, respectively. Waterlogging stress patterns for spring barley include SW0 (minimal waterlogging); SW1 (low moderate-late waterlogging); SW2 (late-onset moderate waterlogging); SW3 (late-onset severe waterlogging) and winter barley, WW0 (minimal waterlogging); WW1 (low early-onset waterlogging relieved later); WW2 (moderate early-onset waterlogging); WW3 (severe early-onset waterlogging). Data in (b), (c), (e) and (f) are presented as mean ± standard errors of the mean of GCMs (n = 27). Data were analysed using one-way analysis of variance followed by least significant difference (LSD) post-hoc tests. Different letters in (b), (c), (e) and (f) above the bars indicate significant differences in the frequency of stress patterns between climate periods (P < 0.05). Exact P values include: 4.96e-08 (SW0 for ES in spring barley), 0.46 (SW1 for ES in spring barley), 1.47e-04 (SW2 for ES in spring barley), 2.61e-08 (SW3 for ES in spring barley), 7.44e-07 (SW0 for LS in spring barley), 2.88e-05(SW1 for LS in spring barley), 5.39e-04 (SW2 for LS in spring barley), 0.49 (SW3 for LS in spring barley), 1.42e−11 (WW0 for ES in winter barley), 2.30e-08 (WW1 for ES in winter barley), 5.66e-06 (WW2 for ES in winter barley), 0.84 (WW3 for ES in winter barley), 3.97e-07 (WW0 for LS in winter barley), 0.97 (WW1 for LS in winter barley), 4.93e-04 (WW2 for LS in winter barley) and 6.01e-09 (WW3 for LS in winter barley).
Fig. 5
Fig. 5. Mean and standard error of the mean (SEM) for grain yield benefit associated with waterlogging tolerant genotypes relative to waterlogging susceptible genotypes for 2040 (2030–2059).
Values were computed across years and 27 GCMs in which barley growing season rainfall was higher than the 90th percentile; numerical values shown in each panel represent mean grain yield benefit across sites, years and GCMs. The map was modified using R package ggplot2’maps (version 3.4.0)’ with the Natural Earth dataset in a public domain (https://www.naturalearthdata.com).

References

    1. Lobell DB, et al. The critical role of extreme heat for maize production in the United States. Nat. Clim. Change. 2013;3:497–501.
    1. Trnka M, et al. Adverse weather conditions for European wheat production will become more frequent with climate change. Nat. Clim. Change. 2014;4:637–643.
    1. Harrison MT. Climate change benefits negated by extreme heat. Nat. Food. 2021;2:855–856. - PubMed
    1. Cassman KG, Grassini P. A global perspective on sustainable intensification research. Nat. Sustain. 2020;3:262–268.
    1. Harrison MT, et al. Carbon myopia: the urgent need for integrated social, economic and environmental action in the livestock sector. Glob. Change Biol. 2021;27:5726–5761. - PMC - PubMed

Publication types