. 2023 Feb 10;13(1):2398.
doi: 10.1038/s41598-023-29523-x.

Stability of olfactory behavior syndromes in the Drosophila larva

Affiliations

Stability of olfactory behavior syndromes in the Drosophila larva

Seth R Odell et al. Sci Rep. .

Abstract

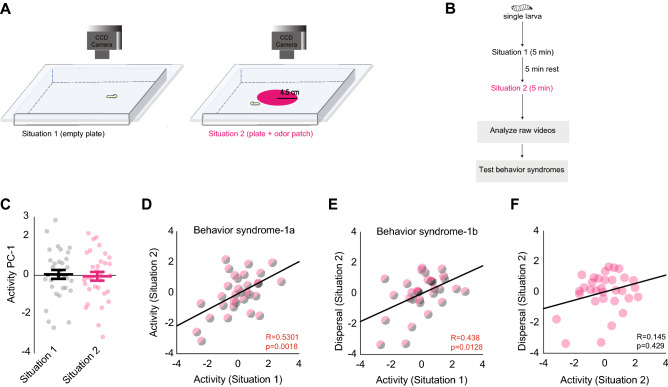
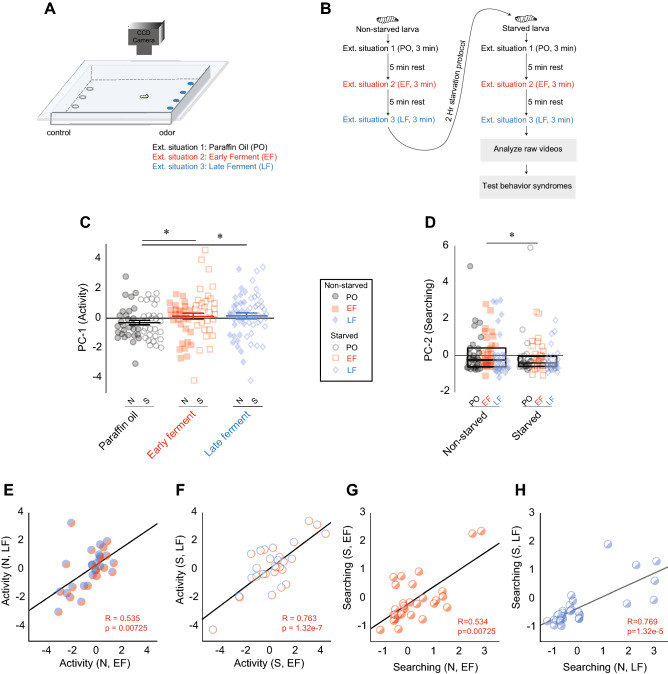
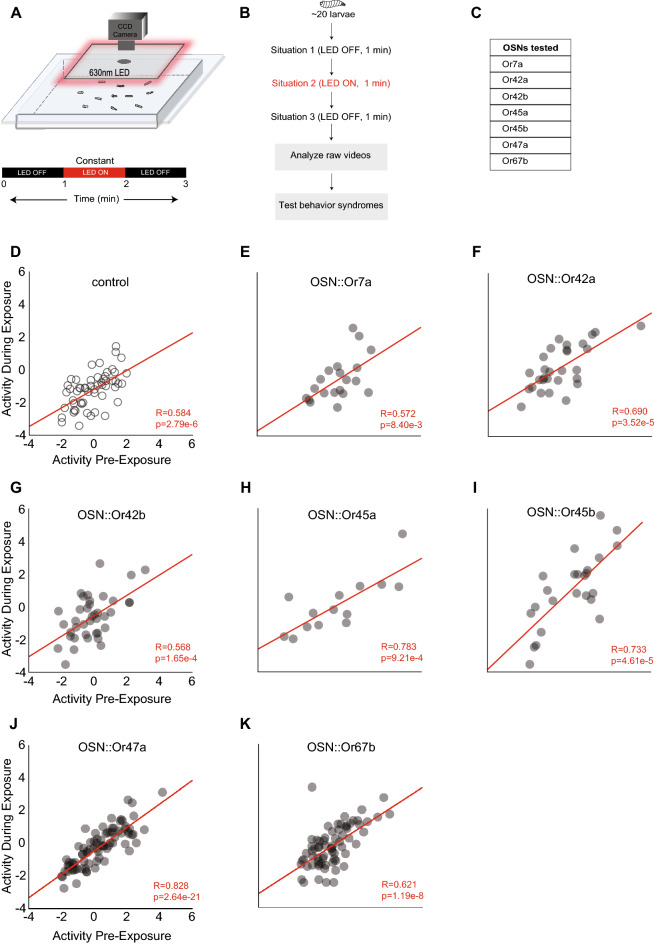
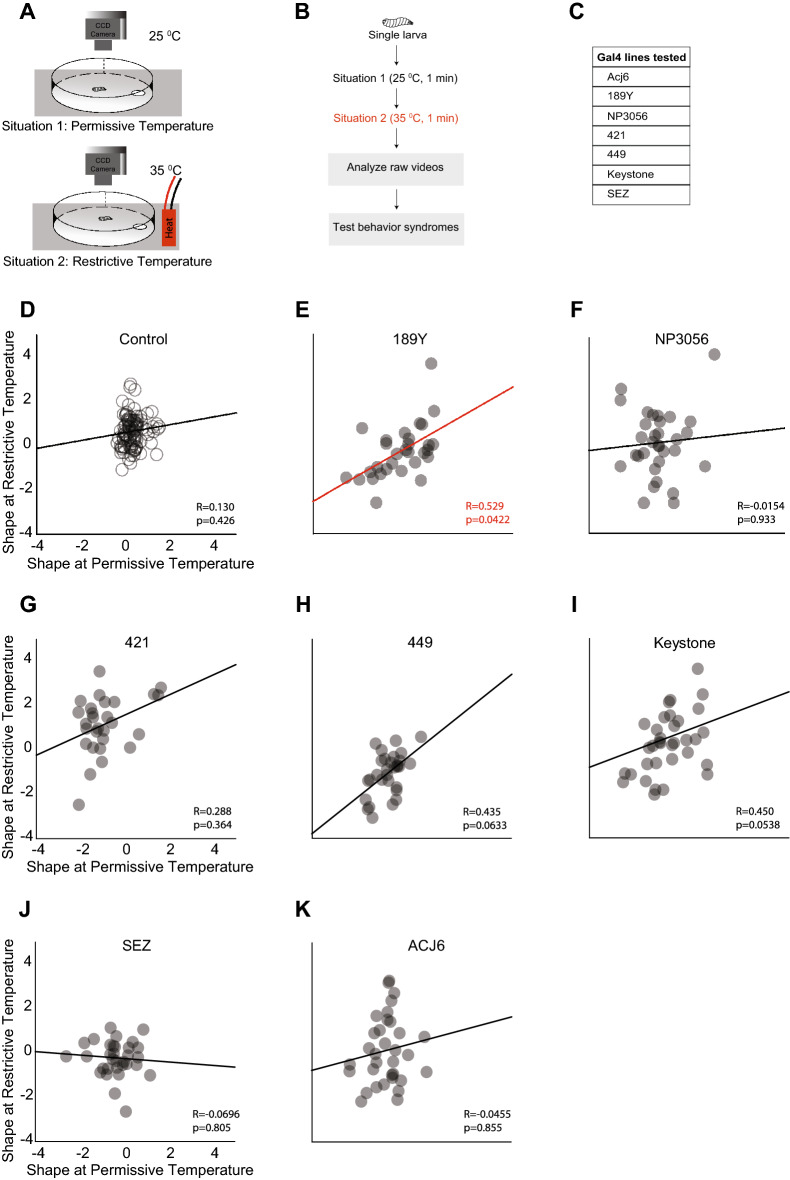
Individuals of many animal populations exhibit idiosyncratic behaviors. One measure of idiosyncratic behavior is a behavior syndrome, defined as the stability of one or more behavior traits in an individual across different situations. While behavior syndromes have been described in various animal systems, their properties and the circuit mechanisms that generate them are poorly understood. We thus have an incomplete understanding of how circuit properties influence animal behavior. Here, we characterize olfactory behavior syndromes in the Drosophila larva. We show that larvae exhibit idiosyncrasies in their olfactory behavior over short time scales. They are influenced by the larva's satiety state and odor environment. Additionally, we identified a group of antennal lobe local neurons that influence the larva's idiosyncratic behavior. These findings reveal previously unsuspected influences on idiosyncratic behavior. They further affirm the idea that idiosyncrasies are not simply statistical phenomena but manifestations of neural mechanisms. In light of these findings, we discuss more broadly the importance of idiosyncrasies to animal survival and how they might be studied.


Conflict of interest statement

The authors declare no competing interests.

Figures

Figure 1
Figure 1
Experiment 1: Stability of olfactory behavior syndromes. (A) A single wild-type larva is exposed to situation 1 (left, empty plate); situation 2 (right, plate with odor patch). Larval movements are recorded by a CCD camera, n = 32. Adapted from Mathew et al.25. (B) A schematic of the paradigm is provided on the right. (C) Average activity measure for larvae in situation 1, n = 32, and situation 2, n = 32. Repeated measures t-test, p = 0.659. (D) Correlation between the activity of a larva in situation 1 and its activity in situation 2. p < 0.05, Pearson’s correlation, n = 31. (E) Correlation between the activity of larva in situation 1 and its dispersal in situation 2. p < 0.05, Spearman’s correlation, n = 32. (F) Correlation between the activity of a larva in situation 2 and its dispersal in situation 2. p = 0.429, Spearman’s correlation, n = 31.
Figure 2
Figure 2
Experiment 2: Effect of internal and external situations. (A) A single non-starved larva is sequentially exposed to three situations: situation 1 (PO: no odor); situation 2 (EF: early ferment odor); situation 3 (LF: late ferment odor). The larva is then starved for 2 h and again exposed to the same situations. Larval movements are recorded by a CCD camera, n = 30. Adapted from Mathew et al.. (B) A schematic of the paradigm is provided on the right. (C) Average activity measure for non-starved (filled shapes) and starved (empty shapes) larvae in situation 1 (black circles), situation 2 (red squares), and situation 3 (blue diamonds). *p = 0.048 (PO vs EF) and *p = 0.0328 (PO vs LF), ANOVA. (D) Average searching measure for the same set of larvae. *p = 0.005, non-parametric ANOVA. (E–H) Correlation examples: (E) between the activity of non-starved larvae in situation 2 and its activity in situation 3. p < 0.025, Pearson’s correlation, n = 28; (F) between the activity of starved larvae in situation 2 and its activity in situation 3. p < 0.0001, Pearson’s correlation, n = 28; (G) between searching of larvae in situation 2 when non-starved and its searching in the same situation when starved. p < 0.025, Spearman’s correlation, n = 28; (H) between ‘searching’ of larvae in situation 3 when non-starved and its ‘searching’ in the same situation when starved. p < 0.025, Spearman’s correlation, n = 28.
Figure 3
Figure 3
Experiment 3: Influence of sensory neurons on olfactory behavior syndromes. (A) ~ 20 transgenic larvae, each expressing ChRhodopsin in a single pair of olfactory sensory neurons (OSNs), are allowed to roam freely on an agarose arena. OSNs expressing ChRhodopsin are activated by shining red light (630 nm) on the arena. Larvae are subjected to three situations: situation 1 (pre-exposure: lights OFF, 1 min.); situation 2 (during-exposure: lights ON, 1 min.); situation 3 (post-exposure: lights OFF, 1 min.). Larval movements are recorded by a CCD camera. Adapted from Clark et al.. The assay is repeated 5 times for each set of OSNs targeted and control animals. (B) A schematic of the paradigm and (C) a list of seven OSNs targeted in this study are provided on the right. (D-K) Correlations between the activity of larva in situation 1 (pre-exposure) and its activity in situation 2 (during exposure) are shown for (D) control larvae, p = 2.79e-6, n = 55, and for larvae in which the following OSNs are activated: (E) OSN::Or7a, p = 8.40e-3, n = 20; (F) OSN::Or42a, p = 3.25e-5, n = 28; (G) OSN::Or42b, p = 1.65e-4, n = 39; (H) OSN::Or45a, p = 9.21e-4, n = 14; (I) OSN::45b, p = 4.61e-5, n = 25; (J) OSN::Or47a, p = 2.64e-21, n = 15; (K) OSN::Or67b, p = 1.19e-8, n = 16. Pearson’s correlation.
Figure 4
Figure 4
Experiment 4: Influence of antennal lobe neurons on olfactory behavior syndromes. (A) A single larva expressing Shits in a set of target neurons is allowed to roam freely in a 6-cm Petri dish layered with agarose. Target neurons are inactivated by raising the temperature of the arena to 35 °C. Larval movements are recorded under situation 1 (25 °C) and situation 2 (35 °C). The assay is repeated for ~ 90 larvae in the parental control line and ~ 30 larvae for each experimental line. (B) A schematic of the paradigm and (C) a list of seven Gal4s used to target specific sets of downstream neurons are provided on the right. (D–K) Correlations between the shape of larval movement in situation 1 (permissive temperature, 25 °C) and restrictive temperature, 35 °C) are shown (D) control larvae, p = 0.426, n = 93 and larvae in which sets of neurons targeted by the following Gal4 lines are inactivated: (E) 189Y, p = 0.0422, n = 30; (F) NP3056, p = 0.933, n = 32; (G) 421, p = 0.364, n = 28; (H) 449, p = 0.0633, n = 30; (I) Keystone, p = 0.0538, n = 35; (J) SEZ, p = 0.805, n = 32; (K) Acj6, p = 0.855, n = 33.

References

    1. Sih A, Bell AM. Insights for behavioral ecology from behavioral syndromes. Adv. Study Behav. 2008;38:227–281. doi: 10.1016/S0065-3454(08)00005-3. - DOI - PMC - PubMed
    1. Sih A, Bell AM, Johnson JC, Ziemba RE. Behavioral syndromes: An intergrative overiew. Q. Rev. Biol. 2004;79:241–277. doi: 10.1086/422893. - DOI - PubMed
    1. Schuett W, et al. Life-history trade-offs mediate ‘personality’ variation in two colour morphs of the pea aphid, Acyrthosiphon pisum. J. Anim. Ecol. 2015;84:90–101. doi: 10.1111/1365-2656.12263. - DOI - PubMed
    1. Feng G, Zhou B, Zhou W, Beauchamp MS, Magnotti JF. A laboratory study of the McGurk Effect in 324 monozygotic and dizygotic twins. Front. Neurosci. 2019;13:1029. doi: 10.3389/fnins.2019.01029. - DOI - PMC - PubMed
    1. Wise PM, Hansen JL, Reed DR, Breslin PA. Twin study of the heritability of recognition thresholds for sour and salty taste. Chem. Senses. 2007;32:749–754. doi: 10.1093/chemse/bjm042. - DOI - PMC - PubMed

Publication types

Substances

LinkOut - more resources