. 2023 Jul;44(7):1322-1336.
doi: 10.1038/s41401-023-01058-x. Epub 2023 Feb 10.

Botulinum neurotoxin A ameliorates depressive-like behavior in a reserpine-induced Parkinson's disease mouse model via suppressing hippocampal microglial engulfment and neuroinflammation

Affiliations

Botulinum neurotoxin A ameliorates depressive-like behavior in a reserpine-induced Parkinson's disease mouse model via suppressing hippocampal microglial engulfment and neuroinflammation

Yang Li et al. Acta Pharmacol Sin. 2023 Jul.

Abstract

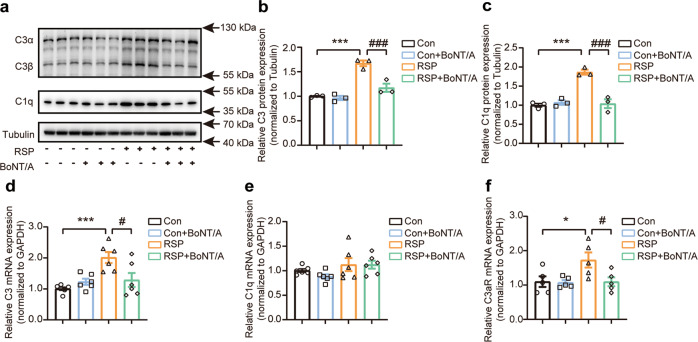
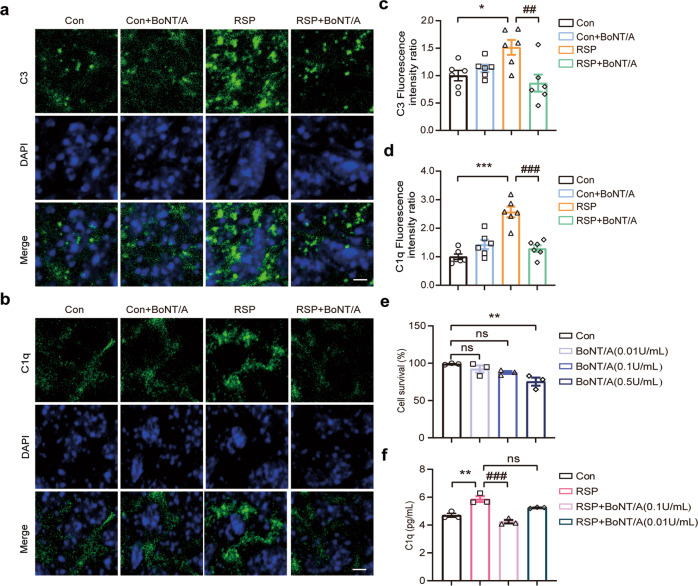
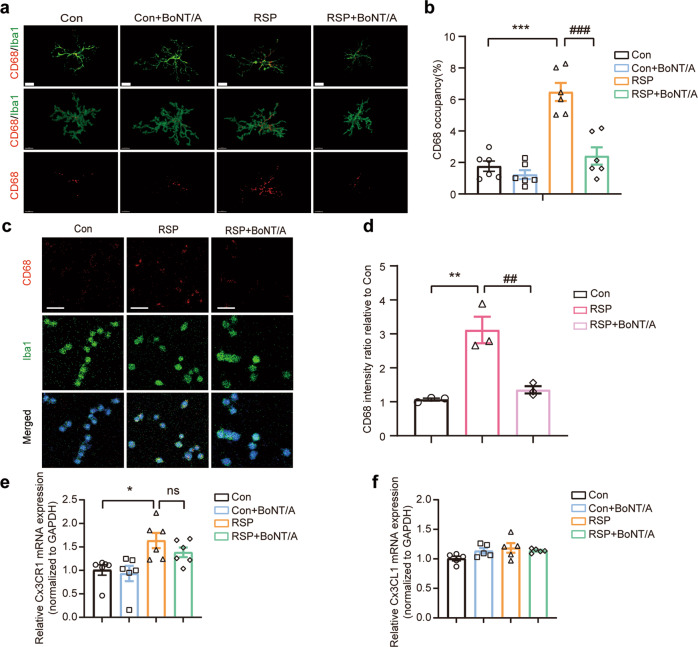
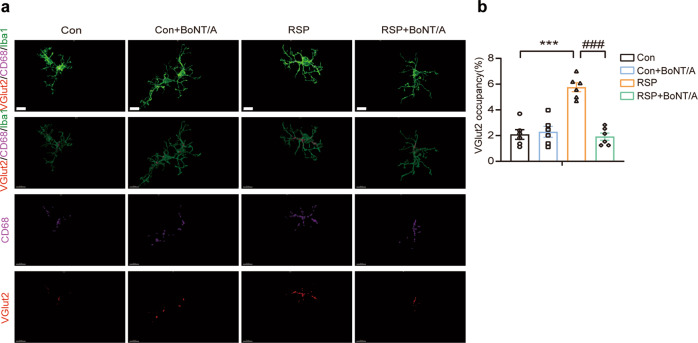
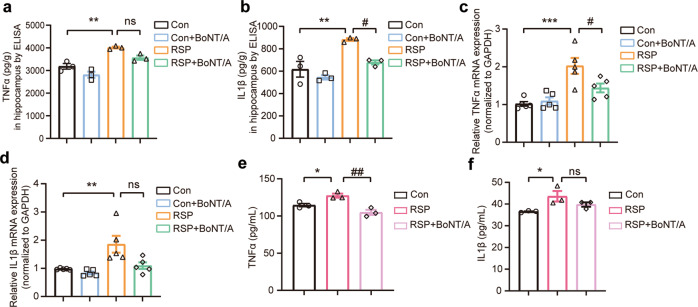
Depression is one of the common non-motor symptoms of Parkinson's disease (PD). In the clinic, botulinum neurotoxin A (BoNT/A) has been used to treat depression. In this study, we investigated the mechanisms underlying the anti-depressive effect of BoNT/A in a PD mouse model. Mice were administered reserpine (3 μg/mL in the drinking water) for 10 weeks. From the 10th week, BoNT/A (10 U·kg-1·d-1) was injected into the cheek for 3 consecutive days. We showed that chronic administration of reserpine produced the behavioral phenotypes of depression and neurochemical changes in the substantia nigra pars compacta (SNpc) and striatum. BoNT/A treatment significantly ameliorated the depressive-like behaviors, but did not improve TH activity in SNpc of reserpine-treated mice. We demonstrated that BoNT/A treatment reversed reserpine-induced complement and microglia activation in the hippocampal CA1 region. Furthermore, BoNT/A treatment significantly attenuated the microglial engulfment of presynaptic synapses, thus ameliorating the apparent synapse and spine loss in the hippocampus in the reserpine-treated mice. Moreover, BoNT/A treatment suppressed microglia-mediated expression of pro-inflammatory cytokines TNF-α and IL-1β in reserpine-treated mice. In addition, we showed that BoNT/A (0.1 U/mL) ameliorated reserpine-induced complement and microglia activation in mouse BV2 microglial cells in vitro. We conclude that BoNT/A ameliorates depressive-like behavior in a reserpine-induced PD mouse model through reversing the synapse loss mediated by classical complement induced-microglial engulfment as well as alleviating microglia-mediated proinflammatory responses. BoNT/A ameliorates depressive-like behavior, and reverses synapse loss mediated by classical complement pathway-initiated microglia engulfment as well as alleviates microglia-mediated proinflammatory response in the reserpine-induced Parkinson's disease mouse model.

Keywords: Parkinson’s disease; botulinum neurotoxin A; complement; depression; microglia; reserpine.


Conflict of interest statement

The authors declare no competing interests.

Figures

None
BoNT/A ameliorates depressive-like behavior, and reverses synapse loss mediated by classical complement pathway-initiated microglia engulfment as well as alleviates microglia-mediated proinflammatory response in the reserpine-induced Parkinson’s disease mouse model.
Fig. 1
Fig. 1. Reserpine-induced behavioral outcomes and neurochemical features of depression in a mouse model of Parkinson’s disease.
a Experimental paradigm for behavioral testing. b The bodyweight of mice (F interaction (10, 198) = 0.1216, P = 0.9995). c The total movement time in the rotarod test (F interaction (10, 176) = 6.1666, P < 0.0001). d The latency time in the pole climbing test (F interaction (10, 176) = 2.281, P = 0.0155). e The total distance traveled in the open field test (F interaction (10, 154) = 3.442, P = 0.0004). f Performance in the SPT (t = 2.333, df = 10, P = 0.0419). g Performance in the FST (F interaction (10, 154) = 2.805, P = 0.0032). h Performance in the TST (F interaction (10, 154) = 3.306, P = 0.0007). i, j Substantia nigra (i) and striatal (j) dopamine concentrations were detected by HPLC (for substantia nigra dopamine, t = 3.005, df = 6, P = 0.0239. For striatal dopamine, t = 2.884, df = 6, P = 0.0279). k Striatal dopamine concentrations were determined by ELISA (t = 3.614, df = 6, P = 0.0112). l Immunoblotting analysis of the expression of TH in the SNpc. m Quantification of TH protein expression normalized to GAPDH in the SNpc (t = 3.813, df = 4, P = 0.0189). All data are presented as the mean ± SEM. n = 6–10 mice for each group in the behavioral test. n = 3–6 mice for each group in the neurochemical test. Two-way ANOVA followed by Bonferroni’s multiple comparison test and an unpaired Student’s t test were used. *P  <  0.05, **P  <  0.01, ***P  <  0.001, versus Con group.
Fig. 2
Fig. 2. BoNT/A treatment ameliorated reserpine-induced depressive-like behavior but not TH activity in mice.
a Experimental paradigm for behavioral testing. Reserpine was prepared in drinking water at 3 μg/mL and administered to male ICR mice (6–8 weeks old). The depressive-like behavioral test was performed every week for 10 weeks. BoNT/A was injected into the mouse cheek (10 U/kg) once per day for three consecutive days. Depressive-like behavior was tested three days later and every week until the 14th week. b The effect of BoNT/A treatment on body weight was measured (n = 8 mice for each group, F interaction (48, 476) = 1.879, P = 0.0006). c, d Effect of BoNT/A treatment on performance in the FST (c) and TST (d) (n = 8 mice for each group, FST, F interaction (48, 476) = 3.320, P < 0.0001. For TST, F interaction (48, 476) = 1.487, P = 0.0222). e Immunoblotting analysis of the expression of TH in the substantia nigra pars compacta (SNpc) with BoNT/A treatment in reserpine-treated mice. f Quantification of TH protein expression normalized to GAPDH in the SNpc (n = 3 mice for each group, F (3, 8) = 4.316, P = 0.0436). g Representative images of tyrosine hydroxylase (TH)-stained neurons in the SNpc. Scale bar = 100 μm. h Quantification of TH-positive neurons relative to the Con group in the SNpc (n = 3 mice for each group, F (3, 8) = 3.767, P = 0.0593). All data are presented as the mean ± SEM. Two-way ANOVA followed by Bonferroni’s multiple comparison test and one-way ANOVA with Tukey’s post hoc test were used. *P < 0.05, **P < 0.01, ***P < 0.001, versus Con group. #P < 0.05, ##P < 0.01, ###P < 0.001.
Fig. 3
Fig. 3. BoNT/A treatment inhibited complement expression in the reserpine-treated mouse hippocampus.
a Immunoblotting analysis of the expression of complement proteins C3 and C1q. b, c Quantification of complement C3 protein (b) and C1q protein (c) expression normalized to Tubulin (n = 3 mice for each group, For C3, F (3, 8) = 34.09, P < 0.0001. For C1q, F (3, 8) = 29.37, P = 0.0001). d-f Complement C3 (d), C1q (e), and C3aR (f) mRNA expression levels were determined by qRT‒PCR (n = 5–6 mice for each group, For C3, F (3, 20) = 8.045, P = 0.0010. For C1q, F (3, 20) = 1.978, P = 0.1498. For C3aR, F (3, 16) = 4.338, P = 0.0204). All data are presented as the mean ± SEM. One-way ANOVA with Tukey’s post hoc test was used. *P  <  0.05, ***P  <  0.001, versus Con group. #P  <  0.05, ###P  <  0.001, versus the RSP group.
Fig. 4
Fig. 4. BoNT/A treatment inhibited the activation of the classical complement pathway in vivo and in vitro.
a, b Immunostaining of complement C3 (a) and C1q (b) in the hippocampal CA1 regions. Scale bar = 5 μm. c, d Quantification of complement C3 (c) and C1q (d) fluorescence intensity (n = 6 images from 3 mice for each group. For C3, F (3, 20) = 5.604, P = 0.0059). For C1q, F (3, 20) = 22.60, (P < 0.0001). e Cell viability of BV2 microglial cells exposed to BoNT/A (0.01 U/mL, 0.1 U/mL, and 0.5 U/mL) for 24 h was determined by the CCK-8 assay (n = 3 replicates for each group. F (3, 8) = 7.122, P = 0.0120). f Complement C1q in the cell media secreted by BV2 microglial cells was detected by ELISA (n = 3 replicates for each group. F (3, 8) = 23.71, P = 0.0002). All data are presented as the mean ± SEM. One-way ANOVA with Tukey’s post hoc test was used. *P  <  0.05, **P  <  0.01, ***P  <  0.001, versus Con group. ##P  <  0.01, ###P  <  0.001, versus RSP group.
Fig. 5
Fig. 5. BoNT/A treatment suppressed microglial activation in vivo and in vitro.
a Representative immunostaining images of the microglial marker Iba1 (green) and lysosomal marker CD68 (red) in the hippocampal CA1 regions (top) and corresponding 3D reconstructed images. Scale bar = 10 μm. b Quantification of the percentage of CD68+ lysosome volume in Iba1+ microglia volume (n = 6 images from 3 mice for each group. F (3, 20) = 27.82, P < 0.0001). c Representative immunostaining images of the microglial marker Iba1 (green) and lysosomal marker CD68 (red) in BV2 microglial cells exposed to 50 nM reserpine (RSP) for 24 h in the presence or absence of BoNT/A (0.1 U/mL). Scale bar = 50 μm. d Quantification of the relative CD68+ lysosome fluorescence intensity in Iba1+ microglia (n = 3 replicates for each group). F (2, 6) = 22.26, (P = 0.0017). e, f Chemokine receptor CX3CR1 (e) and fractalkine CX3CL1 (f) mRNA expression levels in the hippocampal samples were measured by qRT‒PCR (n = 5–6 mice for each group. For CX3CR1, F (3, 20) = 5.718, P = 0.0054). For CX3CL1, F (3, 16) = 2.236, (P = 0.1235). All data are presented as the mean ± SEM. One-way ANOVA with Tukey’s post hoc test was used. *P  <  0.05, **P  <  0.01, ***P < 0.001, versus Con group. ##P  <  0.01, ###P  <  0.001, versus RSP group.
Fig. 6
Fig. 6. BoNT/A treatment alleviated synapse and spine loss in the reserpine-treated mouse hippocampus.
a, b Representative immunostaining images of excitatory presynaptic marker VGlut2 (red) and postsynaptic marker PSD95 (green) (a) and inhibitory presynaptic marker VGAT (red) and postsynaptic marker Gephyrin (green) (b) in the hippocampal CA1 regions. Scale bar = 5 μm. c, d Quantification of individual and colocalized excitatory pre- and postsynaptic markers (c) and inhibitory pre- and postsynaptic markers (d) (n = 6 images from 3 mice for each group. For VGlut2, F (3, 20) = 7.739, P = 0.0013. For PSD95, F (3, 20) = 7.603, P = 0.0014. For VGlut2 + PSD95, F (3, 20) = 9.593, P = 0.0004. For VGAT, F (3, 20) = 1.191, P = 0.3384. For Gephyrin, F (3, 20) = 0.2680, P = 0.8476. For VGAT + Gephyrin, F (3, 20) = 2.016, P = 0.1440). e Representative images of Golgi-stained dendrite spines of pyramidal neurons in the hippocampal CA1 regions. Scale bar = 5 μm. f Quantification of the dendrite spine density of pyramidal neurons in the hippocampal CA1 regions (n = 12 images from 3 mice for each group. F (3, 44) = 27.26, P < 0.0001). All data are presented as the mean ± SEM. One-way ANOVA with Tukey’s post hoc test was employed. *P  <  0.05, ***P  <  0.001, versus Con group. #P  <  0.05, ##P  <  0.01, ###P  <  0.001, versus the RSP group.
Fig. 7
Fig. 7. BoNT/A treatment alleviated synapse and spine loss in the reserpine-treated mouse hippocampus.
a Representative immunostaining images of presynaptic marker VGlut2 (red), lysosomal marker CD68 (magenta), and microglial marker Iba1 (green) in the hippocampal CA1 regions, the corresponding 3D construction of VGlut2 (red), CD68 (magenta), and Iba1 (green) channels by Imaris, as well as 3D reconstructed images of the microglial lysosome contents (magenta) and engulfed synaptic contents (red). Scale bar = 10 μm. b Quantification of the percentage of engulfed VGlut2+ synaptic volume in Iba1+ microglial volume (n = 6 images from 3 mice for each group. F (3, 20) = 25.95, P < 0.0001). All data are presented as the mean ± SEM. One-way ANOVA with Tukey’s post hoc test was applied. ***P  <  0.001, versus Con group. ###P  <  0.001, versus RSP group.
Fig. 8
Fig. 8. BoNT/A treatment ameliorated microglia-mediated neuroinflammation in vivo and in vitro.
a, b Hippocampal TNF-α (a) and IL-1β (b) protein concentrations were measured by ELISA (n = 3 mice for each group. For TNF-α, F (3, 8) = 23.78, P = 0.0002. For IL-1β, F (3, 8) = 14.50, P = 0.0013). c, d Hippocampal TNF-α (c) and IL-1β (d) mRNA expression was determined by qRT‒PCR (n = 5 mice for each group. For TNF-α, F (3, 16) = 11.79, P = 0.0003. For IL-1β, F (3, 16) = 7.872, P = 0.0019). e, f BV2 microglial cells were exposed to 50 nM reserpine (RSP) for 24 h in the presence or absence of BoNT/A (0.1 U/mL). TNF-α (e) and IL-1β (f) in the cell media secreted by BV2 microglial cells were detected by ELISA (n = 3 replicates for each group. For TNF-α, F (2, 6) = 15.95, P = 0.0040. For IL-1β, F (2, 6) = 5.393, P = 0.0457). All data are presented as the mean ± SEM. One-way ANOVA with Tukey’s post hoc test was used. *P  <  0.05, **P  < 0.01, ***P  <  0.001, versus Con group. #P  <  0.05, ##P  <  0.01, versus the RSP group.

References

    1. de Rijk MC, Launer LJ, Berger K, Breteler MM, Dartigues JF, Baldereschi M, et al. Prevalence of Parkinson’s disease in Europe: A collaborative study of population-based cohorts. Neurologic Diseases in the Elderly Research Group. Neurology. 2000;54:S21–3. doi: 10.1212/WNL.54.5.21A. - DOI - PubMed
    1. Assogna F, Pellicano C, Savini C, Macchiusi L, Pellicano GR, Alborghetti M, et al. Drug choices and advancements for managing depression in Parkinson’s disease. Curr Neuropharmacol. 2020;18:277–87. doi: 10.2174/1570159X17666191016094857. - DOI - PMC - PubMed
    1. Marinus J, Zhu K, Marras C, Aarsland D, van Hilten JJ. Risk factors for non-motor symptoms in Parkinson’s disease. Lancet Neurol. 2018;17:559–68. doi: 10.1016/S1474-4422(18)30127-3. - DOI - PubMed
    1. Aarsland D, Påhlhagen S, Ballard CG, Ehrt U, Svenningsson P. Depression in Parkinson disease–epidemiology, mechanisms and management. Nat Rev Neurol. 2011;8:35–47. doi: 10.1038/nrneurol.2011.189. - DOI - PubMed
    1. Bhome R, Zarkali A, Thomas GEC, Iglesias JE, Cole JH, Weil RS. Thalamic white matter macrostructure and subnuclei volumes in Parkinson’s disease depression. NPJ Parkinsons Dis. 2022;8:2. doi: 10.1038/s41531-021-00270-y. - DOI - PMC - PubMed

LinkOut - more resources