. 2023 Feb 10;22(1):5.
doi: 10.1186/s12942-023-00326-7.

Cyclists' exposure to air pollution, noise, and greenery: a population-level spatial analysis approach

Affiliations

Cyclists' exposure to air pollution, noise, and greenery: a population-level spatial analysis approach

Elias Willberg et al. Int J Health Geogr. .

Abstract

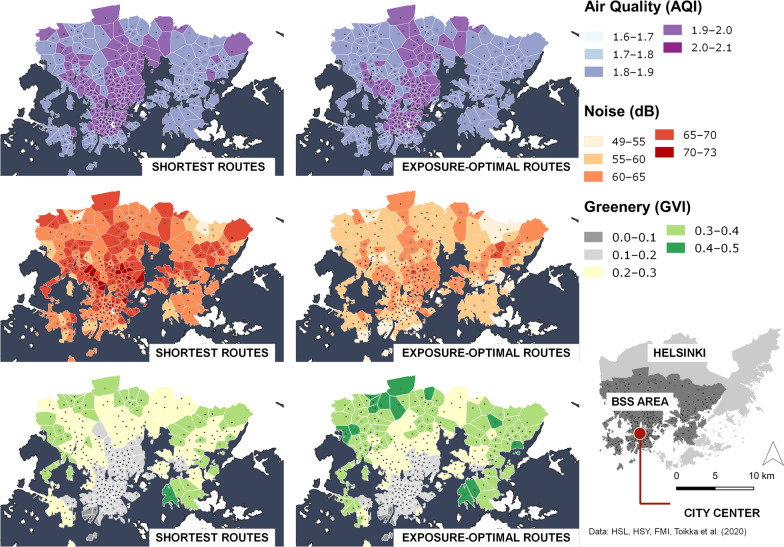
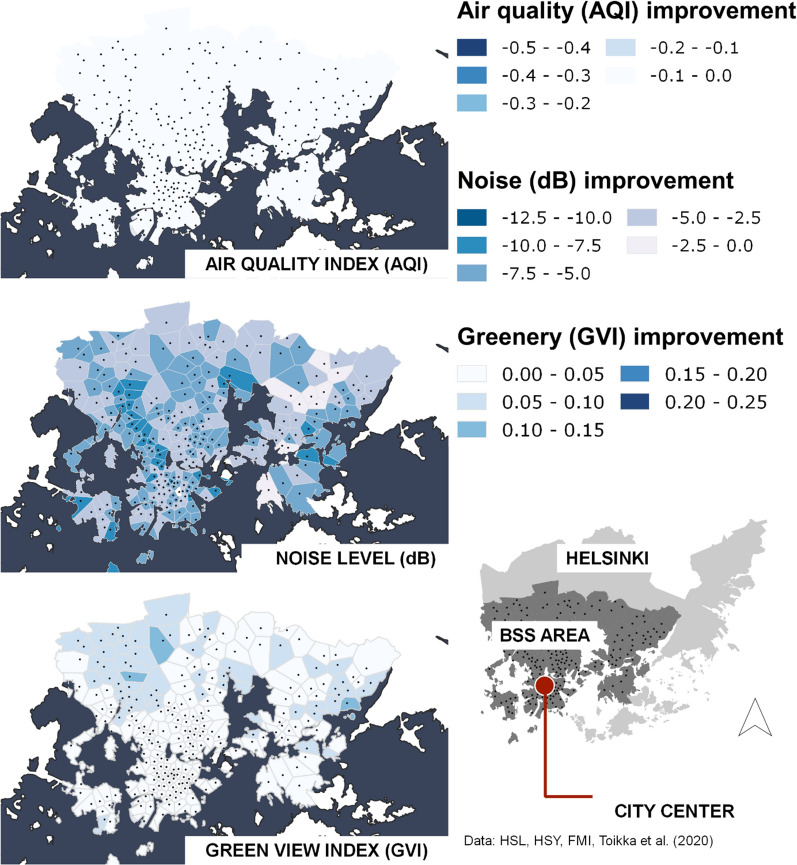
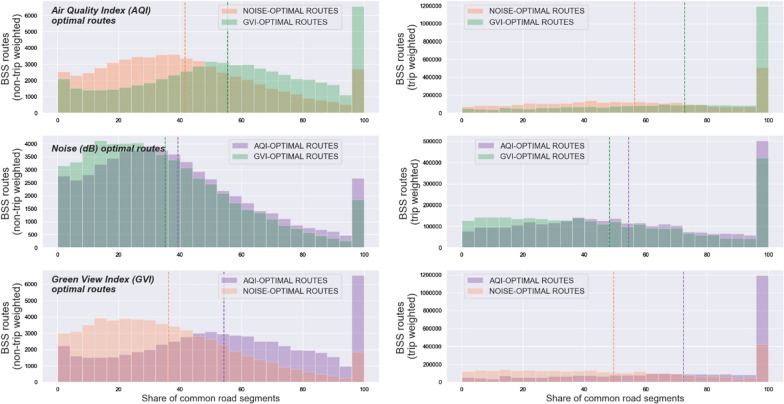
Urban travel exposes people to a range of environmental qualities with significant health and wellbeing impacts. Nevertheless, the understanding of travel-related environmental exposure has remained limited. Here, we present a novel approach for population-level assessment of multiple environmental exposure for active travel. It enables analyses of (1) urban scale exposure variation, (2) alternative routes' potential to improve exposure levels per exposure type, and (3) by combining multiple exposures. We demonstrate the approach's feasibility by analysing cyclists' air pollution, noise, and greenery exposure in Helsinki, Finland. We apply an in-house developed route-planning and exposure assessment software and integrate to the analysis 3.1 million cycling trips from the local bike-sharing system. We show that especially noise exposure from cycling exceeds healthy thresholds, but that cyclists can influence their exposure by route choice. The proposed approach enables planners and individual citizens to identify (un)healthy travel environments from the exposure perspective, and to compare areas in respect to how well their environmental quality supports active travel. Transferable open tools and data further support the implementation of the approach in other cities.

Keywords: Active travel; Air pollution; Environmental exposure; Greenery; Noise; Route choice.


Conflict of interest statement

The authors declare that they have no competing interests.

Figures

Fig. 1
Fig. 1
Example bikes of the Helsinki bike-sharing system. Photo by the authors
Fig. 2
Fig. 2
Flow chart of the analytical process
Fig. 3
Fig. 3
Spatial variation of average trip exposure to air pollution, noise, and greenery aggregated to the bike-sharing station catchment areas. Catchment area represents the area, in which the given station is closer than any other station measured by Euclidean distance. The maps on the left side show the variation for the shortest routes, the maps on the right side show the spatial variation for the exposure-optimal routes over the study area. The black dots on the map show the locations of bike-sharing docking stations
Fig. 4
Fig. 4
The distribution of air pollution, noise, and greenery exposure values for all bike-sharing system routes along the shortest and the exposure-optimal route. Non-trip-weighted distributions are shown on the left and trip-weighted on the right
Fig. 5
Fig. 5
The distribution of detour distances (%) of the exposure-optimal routes compared to the shortest routes for all bike-sharing system origin–destination pairs. On the left, the charts show the distribution for non-trip-weighted routes, in the middle, the distribution for the trip-weighted routes is shown, and on the right, the improvements in average route exposures are plotted against the proportional detour distances. The bars display the detour distance distribution of all alternative exposure routes without any distance threshold, while the black dotted lines display the 15% detour distance threshold that we used in the comparative analyses in this study
Fig. 6
Fig. 6
Average proportion of shared route between air quality, noise, and greenery-optimal routes (trip-weighted) over the study area. The common shares by route are aggregated to the bike-sharing station catchment areas
Fig. 7
Fig. 7
The relationship between air pollution, noise, and greenery values for bike-sharing system routes. On the left, the relationship along the shortest routes is displayed and on the right the relationship along the exposure-optimal routes. The exposure values are aggregated to the mean over the x-axis, and the 95% confidence interval is displayed as a line. In addition, the Pearson correlation coefficient is shown
Fig. 8
Fig. 8
The count of departing bike-sharing trips by the bike-sharing docking station catchment area in 2019 in Helsinki. The catchment areas are delineated with Voronoi polygons
Fig. 9
Fig. 9
The distribution of Air Quality Index (AQI), noise and Green View Index (GVI) values over the study area
Fig. 10
Fig. 10
The spatial variation in opportunities to improve air quality, noise, and greenery exposure with a route choice in cycling trips. The values, which are aggregated to the bike-sharing station catchment areas, represent the average difference (trip-weighted) in air quality, noise, and greenery exposure between the shortest route and the exposure-optimal route. The black dots on the map show the locations of bike-sharing stations
Fig. 11
Fig. 11
The distribution of shared route percentage between the air quality, noise, and greenery optimal routes for all origin–destination pairs. The charts on the left show the non-trip weighted distribution and the charts on the right show the trip-weighted distribution of shared route percentage. The highest bars at the ends of the x-axis correspond to the situation where exposure-optimal route is not available for the given origin–destination pair and therefore the shortest route is used

References

    1. Nieuwenhuijsen MJ. Urban and transport planning pathways to carbon neutral, liveable and healthy cities: a review of the current evidence. Environ Int. 2020;140:105661. - PubMed
    1. Badland H, Pearce J. Liveable for whom? Prospects of urban liveability to address health inequities. Soc Sci Med. 2019;232:94–105. - PubMed
    1. Mueller N, Rojas-Rueda D, Basagaña X, Cirach M, Hunter TC, Dadvand P, et al. Urban and transport planning related exposures and mortality: A health impact assessment for cities. Environ Health Perspect. 2017;125:89–96. doi: 10.1289/EHP220. - DOI - PMC - PubMed
    1. EEA. Healthy environment, healthy lives: how the environment influences health and well-being in Europe. 2020.
    1. WHO. World Health Statistics 2018: Monitoring health for the SDGs. Geneva; 2018. https://apps.who.int/iris/bitstream/handle/10665/272596/9789241565585-en.... Accessed 5 May 2021.

Publication types