. 2023 Feb 10;19(1):3.
doi: 10.1186/s12993-023-00205-y.

Pristane induced lupus mice as a model for neuropsychiatric lupus (NPSLE)

Affiliations

Pristane induced lupus mice as a model for neuropsychiatric lupus (NPSLE)

Yang Yun et al. Behav Brain Funct. .

Abstract

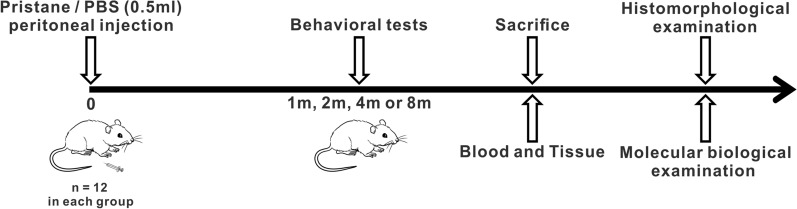
Background: The pristane-induced lupus (PIL) model is a useful tool for studying environmental-related systemic lupus erythematosus (SLE). However, neuropsychiatric manifestations in this model have not been investigated in detail. Because neuropsychiatric lupus (NPSLE) is an important complication of SLE, we investigated the neuropsychiatric symptoms in the PIL mouse model to evaluate its suitability for NPSLE studies.

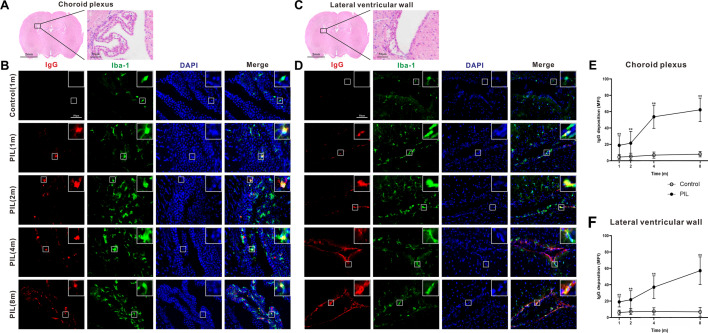
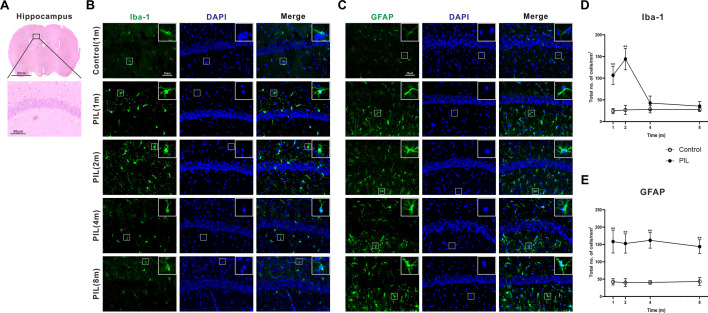
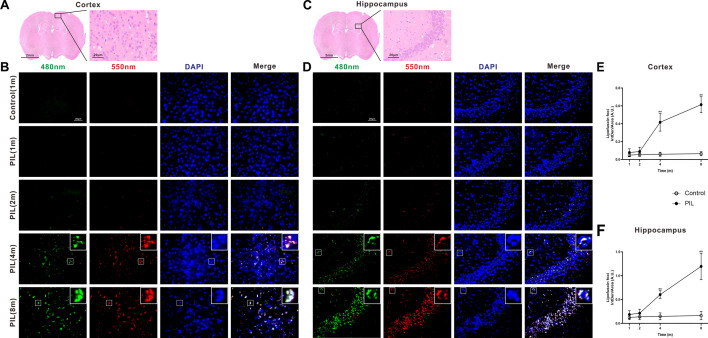
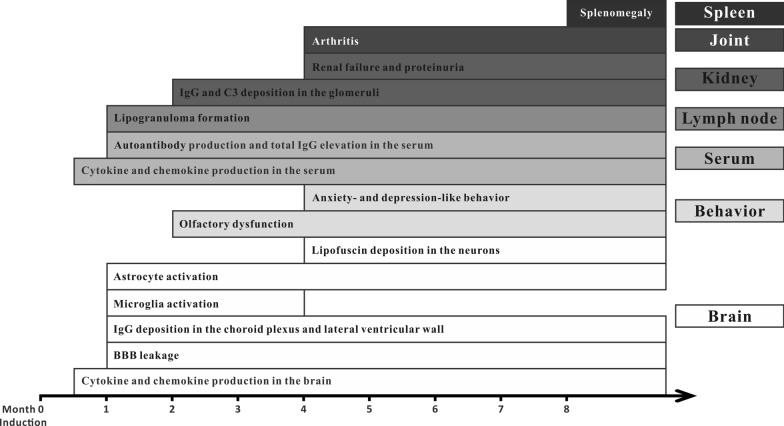
Results: PIL mice showed olfactory dysfunction accompanied by an anxiety- and depression-like phenotype at month 2 or 4 after pristane injection. The levels of cytokines (IL-1β, IFN-α, IFN-β, IL-10, IFN-γ, IL-6, TNF-α and IL-17A) and chemokines (CCL2 and CXCL10) in the brain and blood-brain barrier (BBB) permeability increased significantly from week 2 or month 1, and persisted throughout the observed course of the disease. Notably, IgG deposition in the choroid plexus and lateral ventricle wall were observed at month 1 and both astrocytes and microglia were activated. Persistent activation of astrocytes was detected throughout the observed course of the disease, while microglial activation diminished dramatically at month 4. Lipofuscin deposition, a sign of neuronal damage, was detected in cortical and hippocampal neurons from month 4 to 8.

Conclusion: PIL mice exhibit a series of characteristic behavioral deficits and pathological changes in the brain, and therefore might be suitable for investigating disease pathogenesis and for evaluating potential therapeutic targets for environmental-related NPSLE.

Keywords: Behavioral deficit; Cytokine; Glia cells; IgG; Lipofuscin; Mouse model; Neuropsychiatric lupus.


Conflict of interest statement

The authors declare no competing interests.

Figures

Fig. 1
Fig. 1
Experimental schedule. Mice were administered pristane (0.5 ml) or PBS via intraperitoneal injection. After a battery of behavioral tests, mice were sacrificed at month 1, 2, 4 or 8. Blood and tissue samples were collected for further histomorphological and molecular biological assays
Fig. 2
Fig. 2
Examination for lupus-like symptoms in PIL mice. A Representative images showing lipogranulomas (arrow) adherent to the abdominal surface of the diaphragm in PIL mice. B Serum levels of cytokines (IL-1β, IFN-α, IFN-β, IFN-γ, IL-10, IL-6, IL-17A, TNF-α, TWEAK, BAFF and APRIL), chemokines (CCL2, CXCL10 and CCL7), autoantibodies (anti-chromatin, anti-dsDNA, anti-nRNP and anti-Sm) and total IgG, as detected by ELISA. IL-1β (group effect: F1,22 = 144.5, p < 0.0001; time effect: F3.991,87.81 = 5.593, p = 0.0005; interaction effect: F5,110 = 6.255, p < 0.0001); IFN-α (p < 0.0001, 0.0472, 0.0754); IFN-β (p < 0.0001, < 0.0001, < 0.0001); IFN-γ (p < 0.0001, < 0.0001, < 0.0001); IL-10 (p < 0.0001, < 0.0001, < 0.0001); IL-6 (p < 0.0001, < 0.0001, < 0.0001); IL-17A (p < 0.0001, < 0.0001, < 0.0001); TNF-α (p < 0.0001, 0.3646, 0.3835); TWEAK (p = 0.0657, 0.7505, 0.9879); BAFF (p = 0.0538, 0.1978, 0.6215); APRIL (p = 0.2328, 0.8839, 0.8463); CCL2 (p < 0.0001, 0.0004, < 0.0001); CXCL10 (p < 0.0001, < 0.0001, 0.0037); CCL7 (p = 0.0985, 0.1661, 0.7891); anti-chromatin (p < 0.0001, 0.0004, < 0.0001); anti-dsDNA (p < 0.0001, < 0.0001, < 0.0001); anti-nRNP (p < 0.0001, < 0.0001, < 0.0001); anti-Sm (p < 0.0001, 0.0091, 0.0012) and total IgG (p < 0.0001, < 0.0001, < 0.0001). C Left panel showing representative images of glomeruli stained with H&E. Right panel showing representative images of frozen kidney sections stained for IgG and C3. D Quantitative analysis of the MFI of IgG (p < 0.0001, < 0.0001, < 0.0001) and C3 (p < 0.0001, < 0.0001, < 0.0001) in glomeruli. E Quantitative analysis of Scr (p < 0.0001, < 0.0001, < 0.0001), BUN (p < 0.0001, 0.0430, 0.0024) and 24 h proteinuria (p < 0.0001, 0.0001, < 0.0001). F Upper panel showing representative images of the hind paw, and quantitative analysis of arthritis severity score (p < 0.0001, 0.0004, < 0.0001). Lower panel showing representative images of joint tissues with H&E staining, and quantitative analysis of synovial inflammatory score (p < 0.0001, < 0.0001, < 0.0001). G Representative images of spleen, and quantitative analysis of spleen index (p = 0.0007, 0.0013, 0.0001). The data are expressed as the mean ± SEM (n = 12 in each group). Two-way ANOVA followed by Tukey’s post hoc test or Scheirer–Ray–Hare test: *p < 0.05, **p < 0.01
Fig. 3
Fig. 3
Behavioral assessments of olfactory function and anxiety- and depression-like phenotype. A Olfactory sensitivity test. Time spent sniffing male feces (p < 0.0001, 0.0037, < 0.0001), female feces (p < 0.0001, 0.0378, 0.0003), vinegar (p = 0.0035, 0.2964, 0.8263) or alcohol (p = 0.0055, 0.0248, 0.4079). B Open field test. Left panel showing representative images of the travelled path. Right panel showing quantitative analysis of the total distance travelled (p < 0.0001, 0.0001, 0.0925) and time spent in the center (p < 0.0001, 0.1251, 0.0007). C Elevated zero maze test. Left panel showing representative images of the travelled path. Right panel showing quantitative analysis of the total distance travelled (p < 0.0001, < 0.0001, 0.0056) and time spent in the open arms (%) (p < 0.0001, < 0.0001, 0.0201). D Forced swim test. Quantitative analysis of immobility time (p < 0.0001, 0.0009, 0.3390). The data are expressed as the mean ± SEM (n = 12 in each group). Two-way ANOVA followed by Tukey’s post hoc test or Scheirer–Ray–Hare test: **p < 0.01
Fig. 4
Fig. 4
Behavioral assessments of novel object recognition, social novelty preference, rotarod and PPI tests. A Novel object recognition test. Quantitative analysis of the discrimination ratio (p = 0.1635, 0.0004, 0.6247). B Social novelty preference test. Quantitative analysis of the discrimination ratio (p = 0.6642, 0.0987, 0.6737). C Rotarod test. Quantitative analysis of the mean latency to fall (p = 0.0625, 0.0534, 0.5005). D Quantitative analysis of PPI% at 75 dB (p = 0.1491, 0.0777, 0.9946), 85 dB (p = 0.4376, 0.1693, 0.9995) or 95 dB (p = 0.4960, 0.1589, 0.8579). The data are expressed as the mean ± SEM (n = 12 in each group). Two-way ANOVA followed by Tukey’s post hoc test or Scheirer–Ray–Hare test
Fig. 5
Fig. 5
Levels of brain cytokines and chemokines, and BBB permeability. A Brain levels of cytokines (IL-1β, IFN-α, IFN-β, IL-10, IFN-γ, IL-6, TNF-α, IL-17A, TWEAK, BAFF and APRIL), as detected by ELISA. IL-1β (p < 0.0001, < 0.0001, < 0.0001); IFN-α (p < 0.0001, 0.0149, 0.0016); IFN-β (p < 0.0001, < 0.0001, < 0.0001); IL-10 (p < 0.0001, < 0.0001, < 0.0001); IFN-γ (p < 0.0001, 0.0002, 0.001); IL-6 (p < 0.0001, 0.0012, < 0.0001); TNF-α (p < 0.0001, < 0.0001, < 0.0001); IL-17A (p < 0.0001, < 0.0001, < 0.0001); TWEAK (p = 0.0562, 0.6937, 0.9245); BAFF (p = 0.0594, 0.6219, 0.5961) and APRIL (p = 0.9377, 0.0004, 0.4845). B Brain levels of chemokines (CCL2, CXCL10 and CCL7), as detected by ELISA. CCL2 (p < 0.0001, 0.0013, 0.0458); CXCL10 (p < 0.0001, 0.0016, 0.0295) and CCL7 (p = 0.0533, 0.6921, 0.9885). C Quantitative analysis of Evans blue dye extravasation (p < 0.0001, 0.6859, 0.8935). The data are expressed as the mean ± SEM (n = 12 in each group). Two-way ANOVA followed by Tukey’s post hoc test or Scheirer–Ray–Hare test: *p < 0.05, **p < 0.01
Fig. 6
Fig. 6
Examination for IgG deposition in the choroid plexus and lateral ventricular wall. A, C Representative images of the choroid plexus and lateral ventricular wall stained with H&E. B, D Representative images of IgG deposition in the choroid plexus and lateral ventricular wall. White square showing the co-localization of an enlarged Iba-1-immunoreactive microglia (green) and IgG (red). DAPI staining for nuclei (blue). E, F Quantitative analysis of IgG deposition in the choroid plexus (p < 0.0001, < 0.0001, < 0.0001) and lateral ventricular wall (p < 0.0001, < 0.0001, < 0.0001) by MFI. The data are expressed as the mean ± SEM (n = 12 in each group). Two-way ANOVA followed by Tukey’s post hoc test or Scheirer–Ray–Hare test: **p < 0.01
Fig. 7
Fig. 7
Density and morphology of microglia and astrocytes in the hippocampus. A Representative images of the hippocampus stained with H&E. B, C Representative images showing Iba-1-immunoreactive microglia and GFAP-immunoreactive astrocytes in the hippocampus. DAPI staining of nuclei (blue). White square showing an enlarged cell to compare morphology. D, E Quantitative analysis of the density of Iba-1-immunoreactive cells (p < 0.0001, < 0.0001, < 0.0001) and GFAP-immunoreactive cells (p < 0.0001, 0.5512, 0.3670). The data are expressed as the mean ± SEM (n = 12 in each group). Two-way ANOVA followed by Tukey’s post hoc test or Scheirer–Ray–Hare test: **p < 0.01
Fig. 8
Fig. 8
Examination for lipofuscin deposition in the cortex and hippocampus. A and C Representative images of the cortex and hippocampus stained with H&E. B and D Representative images showing autofluorescent lipofuscin at 480 nm (green) and 550 nm (red) exciting light in the cortex and hippocampus. DAPI staining for nuclei (blue). White square showing the co-localization of an enlarged neuron (blue) with autofluorescence (green and red). E and F Quantification analysis of lipofuscin foci in the cortex (p < 0.0001, < 0.0001, < 0.0001) and hippocampus (p < 0.0001, < 0.0001, < 0.0001). The data are expressed as the mean ± SEM (n = 12 in each group). Two-way ANOVA followed by Tukey’s post hoc test or Scheirer–Ray–Hare test: **p < 0.01
Fig. 9
Fig. 9
Peripheral manifestations, behavioral changes and brain pathogenic changes in PIL mice over the trial period

Similar articles

Cited by

References

    1. Stock AD, Wen J, Doerner J, et al. Neuropsychiatric systemic lupus erythematosus persists despite attenuation of systemic disease in MRL/lpr mice. J Neuroinflammation. 2015;12:205. doi: 10.1186/s12974-015-0423-4. - DOI - PMC - PubMed
    1. Vivaldo JF, de Amorim JC, Julio PR, et al. Definition of NPSLE: Does the ACR nomenclature Still Hold? Front Med (Lausanne) 2018;5:138. doi: 10.3389/fmed.2018.00138. - DOI - PMC - PubMed
    1. Popescu A, Kao AH. Neuropsychiatric systemic lupus erythematosus. Curr Neuropharmacol. 2011;9:449–457. doi: 10.2174/157015911796557984. - DOI - PMC - PubMed
    1. Tomita M, Holman BJ, Santoro TJ. Aberrant cytokine gene expression in the hippocampus in murine systemic lupus erythematosus. Neurosci Lett. 2001;302:129–132. doi: 10.1016/s0304-3940(01)01679-2. - DOI - PubMed
    1. Wen J, Stock AD, Chalmers SA, et al. The role of B cells and autoantibodies in neuropsychiatric lupus. Autoimmun Rev. 2016;15:890–895. doi: 10.1016/j.autrev.2016.07.009. - DOI - PMC - PubMed

MeSH terms