. 2023 Feb 10;21(1):113.
doi: 10.1186/s12967-022-03858-x.

Cell-cell communications shape tumor microenvironment and predict clinical outcomes in clear cell renal carcinoma

Affiliations

Cell-cell communications shape tumor microenvironment and predict clinical outcomes in clear cell renal carcinoma

Liu-Xun Chen et al. J Transl Med. .

Abstract

Background: Cell-cell communications of various cell populations within tumor microenvironment play an essential role in primary tumor growth, metastasis evolution, and immune escape. Nevertheless, comprehensive investigation of cell-cell communications in the ccRCC (Clear cell renal carcinoma) microenvironment and how this interplay affects prognosis still remains limited.

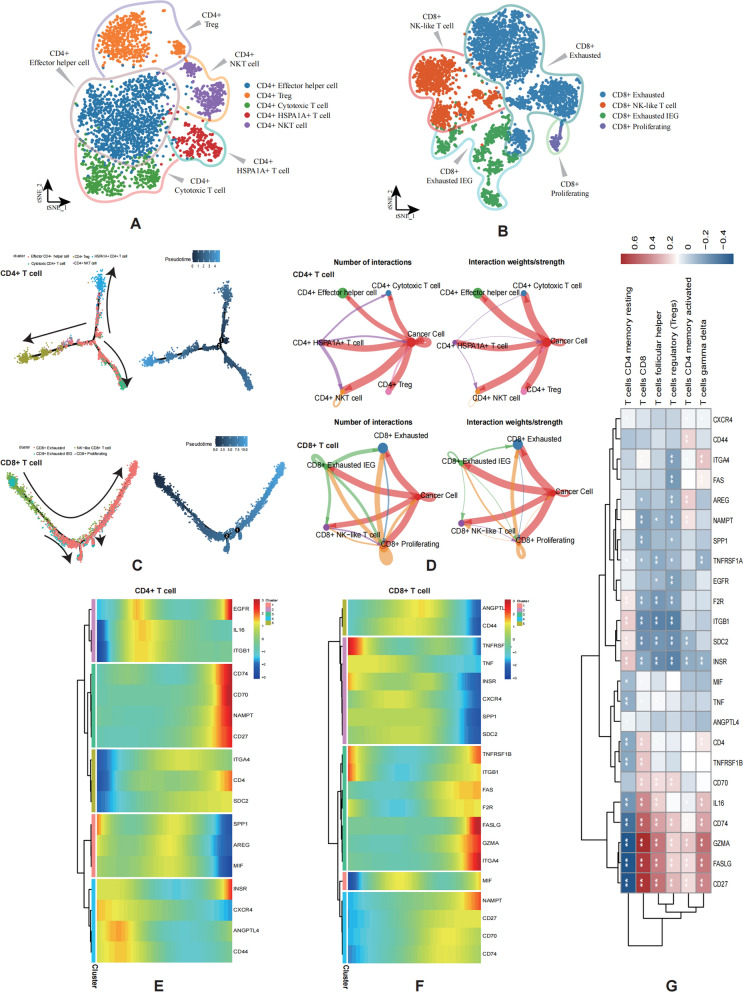
Methods: Intercellular communications were characterized by single-cell data. Firstly, we employed "CellChat" package to characterize intercellular communications across all types of cells in microenvironment in VHL mutated and non-mutated samples from 8 patients, respectively. And pseudotime trajectory analyses were performed with monocle analyses. Finally clinical prognosis and immunotherapy efficacy with different landscapes of intercellular interplay are evaluated by TCGA-KIRC and immunotherapy cohort.

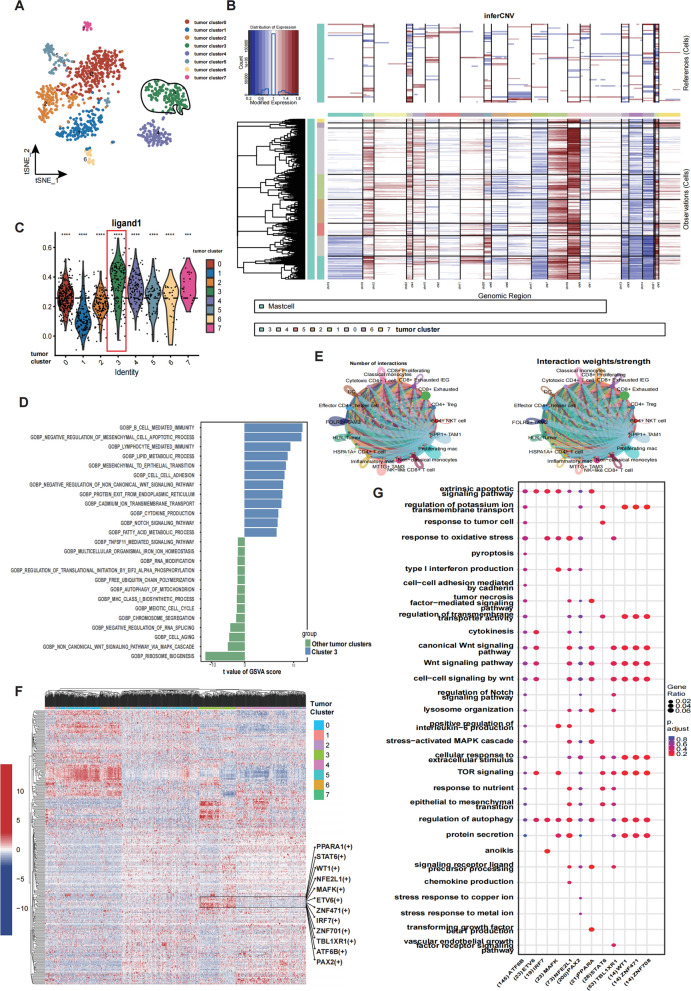
Results: Firstly, the VHL phenotype may be related to the intercellular communication landscape. And trajectory analysis reveals the potential relationship of cell-cell communication molecules with T cells and Myeloid cells differentiation. Furthermore, those molecules also correlate with the infiltration of T cells and Myeloid cells. A tumor cluster with highly expressed ligands was defined by quantitative analysis and transcription factor enrichment analysis, which was identified to be pivotal for intercellular communications in tumor microenvironment. Finally, bulk data indicates bulk that different clusters with different intercellular communications have significant predictive value for prognosis and distinguished immunotherapy efficiency.

Conclusions: The intercellular communication landscapes of VHL wild and VHL mutant ccRCC vary. Intercellular communications within the tumor microenvironment also influence T cell and myeloid cell development and infiltration, as well as predict clinical prognosis and immunotherapy efficacy in ccRCC.

Keywords: Cell–cell communications; Clear cell renal carcinoma; Immunotherapy; Prognosis; Tumor microenvironment.


Conflict of interest statement

The authors declare that they have no competing interests.

Figures

Fig. 1
Fig. 1
Classification and definition of cell types based on scRNA-seq of ccRCC samples. A Seurat t-distributed stochastic neighbor embedding (t-SNE) depiction of transcriptionally different cell populations in the tumor microenvironment from 4 patients. All cells are colored by their cellular annotations. B The heatmap displaying the distribution of cell type-specific genes in our samples. C tSNE view of all cells, color-marked by VHL mutation status. D The t-SNE plot shows the expression levels of cell type-specific genes across 10 clusters
Fig. 2
Fig. 2
Cell–cell communications (CCCs) referenced by CellChat demonstrated notable alterations in receptors-ligands-mediated communications between VHL-wild and VHL-mutated cells in ccRCC. A Circle plots depicting the interaction numbers and interaction strength between VHL-wild and VHL-mutated cells. Blue lines indicate that the displayed communication is decreased in VHL-mutated cells, while red lines indicate that communication is increased in VHL-mutated cells compared with non-VHL group. The arrows indicate the direction of intercellular communication, which were also marked on the right in black for annotation. B NMF clusters based on the communication patterns of different cell components and types of ligands/receptors in VHL-wild group and C VHL-mutated group, The closer the color to red indicates the more contribution of the cell group or signaling pathway to each latent pattern. D scatter plot showing the intensity of the outgoing and incoming interactions in two-dimensional manifold. The size of the circles suggests the numbers of significantly expressed receptor-ligand pathways of different cell populations. E Based on the pairwise Euclidean distance in the shared two-dimensional manifold, we ranked the intersecting signaling pathways of VHL-wild and VHL-mutated groups. The length of the grey rectangle presents a difference in this pathway between the VHL-mutated and VHL-wild groups F The vertical axis is the cell that sends or receives the signal, and the horizontal axis is the pathway that receives or sends the signal. The color of the heat map represents the strength of the signal. The pillars on the upper and right sides are the accumulation of the strength of the vertical axis and the horizontal axis. G Comparison of Integral signal with superimposed input and output signals between VHL-wild and VHL-mutated groups, dot color reflects communication probabilities and dot size represents computed p-values computed from one-sided permutation test. Empty space means the communication probability is zero
Fig. 3
Fig. 3
CCCs modulates the features of myeloid cells. A t-SNE plot depicting the myeloid cell subpopulations’ annotation. B, C Monocle analysis of myeloid cell subtypes, and the cells were ordered by pseudotime. D, E CCCs between main cell types of myeloid cells, tumor clusters by CellChat analysis based on interaction strength and numbers. F Trajectory Analysis suggests the role of CCCs molecules in process of myeloid differentiation. G Heatmap reveals the correlation between expression levels of CCCs molecules and relative abundance of immune cells, Welch’s t test: *P < 0.05; **P < 0.01; ***P < 0.001
Fig. 4
Fig. 4
Differentiation and infiltration of T cells were influenced by CCCs. A, B Cell annotation of CD4 + T cells and CD8 + T cells by t-SNE plot, respectively. C Monocle analysis of CD4 + T cells and CD8 + T cells, which are ordered by pseudotime. D Network plot displaying the interaction strength and numbers of communication between CD4 + T cells, CD8 + T cells and tumor cells respectively. Welch’s t test: *P < 0.05; **P < 0.01; ***P < 0.001. E, F Expression conditions of CCCs molecules in the differentiation of CD4 + T cells and CD8 + T cells, respectively. G Heatmap demonstrating that CCCs molecules correlate with T cell infiltration in tumors
Fig. 5
Fig. 5
Identification of tumor cluster with high expression of ligands. A t-SNE plot displaying classification of tumor cells. B Inferred copy number variations of tumor cells were used to estimate the robustness of classifications. Blue indicates low modified expression, inferring to genomic loss; red indicates high modified gene expression, inferring genomic gain. Internal reference cells refer to mast cells. Observations refer to putative malignant epithelial cells. Genomic regions (chromosomes) are labeled and color-coded. C Violin plot demonstrates the distribution of ligand expression among cancer cells, Welch’s t test: *P < 0.05; **P < 0.01; ***P < 0.001, ****P < 0.0001 D Gene set variation analysis (GSVA) showing the enriched pathways of tumor cluster 3 compared with other tumor clusters. E CCCs between tumor cluster 3 with myeloid cells and T Cells. The bars to the right suggest that the pathways are upregulated in tumor cluster3, with longer bars suggesting more significant variance values. F The expression programs of transcription factors are heterogenous among different tumor clusters, the colors indicate the AUCell regulon activity of the transcription factors (TFs) as red (highly active) and blue (lowly active). TFs upregulated in tumor cluster 3 are marked on the right. G GO analysis of highly expressed transcription factors of tumor cluster 3 targeting downstream genes. The vertical coordinate represents the enriched pathways, and the horizontal coordinate represents the genes regulated downstream of the transcription factor (the number is the number of genes) predicted from the cistarget database
Fig. 6
Fig. 6
CCCs influences clinical prognosis and immunotherapy efficacy. A Unsupervised classification uncovers two clusters (Cluster A, Cluster B), depending on the fractions of myeloid cells, T cells and HLR-tumor cells calculated by CIBERSORTx of TCGA-KIRC cohort, the boxed section is the fraction of HLR tumor. B Kaplan–Meier plot demonstrates that ccRCC patients in Cluster B had a longer survival than Cluster A. C The fraction of immune cells is compared in Cluster A and Cluster B, *p < 0.05; **p < 0.01; ***p < 0.001; NS, not significant. DE Box diagrams exhibited the correlation of stromal and immune calculated by ESTIMATE algorithm with clusters. F Patients in Cluster A have lower TMB levels than those in Cluster B. G Two clusters (Cluster 1 and Cluster 2) of David A. Braun, et al. cohort were identified by CIBERSORTx algorithm. H Kaplan–Meier curves of the OS for the Cluster A and Cluster B

Similar articles

Cited by

References

    1. Barata PC, Rini BI. Treatment of renal cell carcinoma: current status and future directions. Cancer J Clin. 2017;67:507–524. doi: 10.3322/caac.21411. - DOI - PubMed
    1. Bray F, Ferlay J, Soerjomataram I, Siegel RL, Torre LA, Jemal A. Global cancer statistics 2018: GLOBOCAN estimates of incidence and mortality worldwide for 36 cancers in 185 countries. Cancer J Clin. 2018;68:394–424. doi: 10.3322/caac.21492. - DOI - PubMed
    1. Nickerson ML, Jaeger E, Shi Y, Durocher JA, Mahurkar S, Zaridze D, Matveev V, Janout V, Kollarova H, Bencko V, Navratilova M, Szeszenia-Dabrowska N, Mates D, Mukeria A, Holcatova I, Schmidt LS, Toro JR, Karami S, Hung R, Gerard GF, Linehan WM, Merino M, Zbar B, Boffetta P, Brennan P, Rothman N, Chow W-H, Waldman FM, Moore LE. Improved identification of von Hippel-Lindau gene alterations in clear cell renal tumors. Clin Cancer Res. 2008;14:4726–4734. doi: 10.1158/1078-0432.CCR-07-4921. - DOI - PMC - PubMed
    1. Drake CG, Stein MN. The immunobiology of kidney cancer. J Clin Oncol. 2018;36:3547. doi: 10.1200/JCO.2018.79.2648. - DOI - PubMed
    1. Yang D, Jones MG, Naranjo S, Rideout WM, 3rd, Min KHJ, Ho R, Wu W, Replogle JM, Page JL, Quinn JJ, Horns F, Qiu X, Chen MZ, Freed-Pastor WA, McGinnis CS, Patterson DM, Gartner ZJ, Chow ED, Bivona TG, Chan MM, Yosef N, Jacks T, Weissman JS. Lineage tracing reveals the phylodynamics, plasticity, and paths of tumor evolution. Cell. 2022;23:67. - PMC - PubMed