

Neural biomarker diagnosis and prediction to mild cognitive impairment and Alzheimer's disease using EEG technology
- PMID: 36765411
- PMCID: PMC9912534
- DOI: 10.1186/s13195-023-01181-1
Neural biomarker diagnosis and prediction to mild cognitive impairment and Alzheimer's disease using EEG technology
Abstract
Background: Electroencephalogram (EEG) has emerged as a non-invasive tool to detect the aberrant neuronal activity related to different stages of Alzheimer's disease (AD). However, the effectiveness of EEG in the precise diagnosis and assessment of AD and its preclinical stage, amnestic mild cognitive impairment (MCI), has yet to be fully elucidated. In this study, we aimed to identify key EEG biomarkers that are effective in distinguishing patients at the early stage of AD and monitoring the progression of AD.
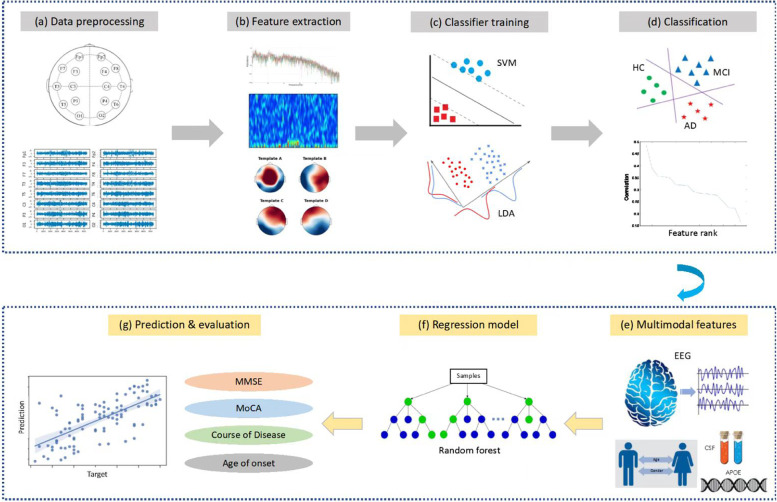
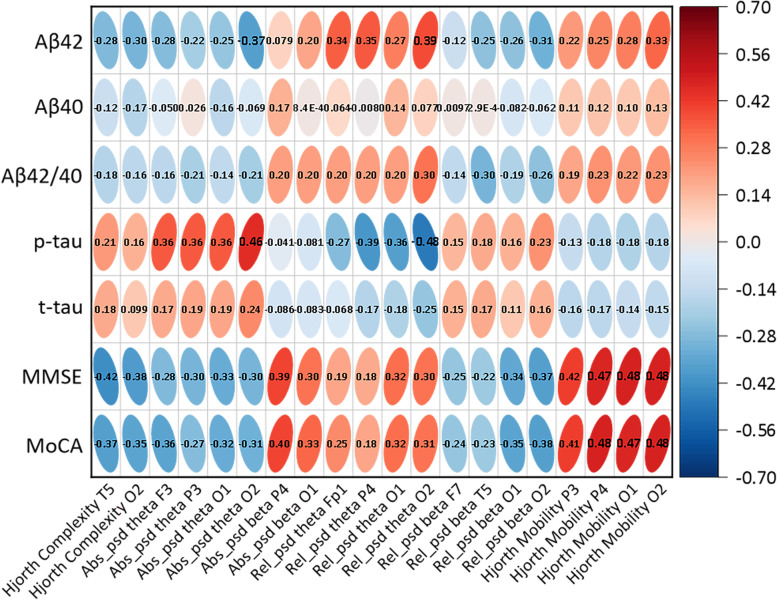
Methods: A total of 890 participants, including 189 patients with MCI, 330 patients with AD, 125 patients with other dementias (frontotemporal dementia, dementia with Lewy bodies, and vascular cognitive impairment), and 246 healthy controls (HC) were enrolled. Biomarkers were extracted from resting-state EEG recordings for a three-level classification of HC, MCI, and AD. The optimal EEG biomarkers were then identified based on the classification performance. Random forest regression was used to train a series of models by combining participants' EEG biomarkers, demographic information (i.e., sex, age), CSF biomarkers, and APOE phenotype for assessing the disease progression and individual's cognitive function.
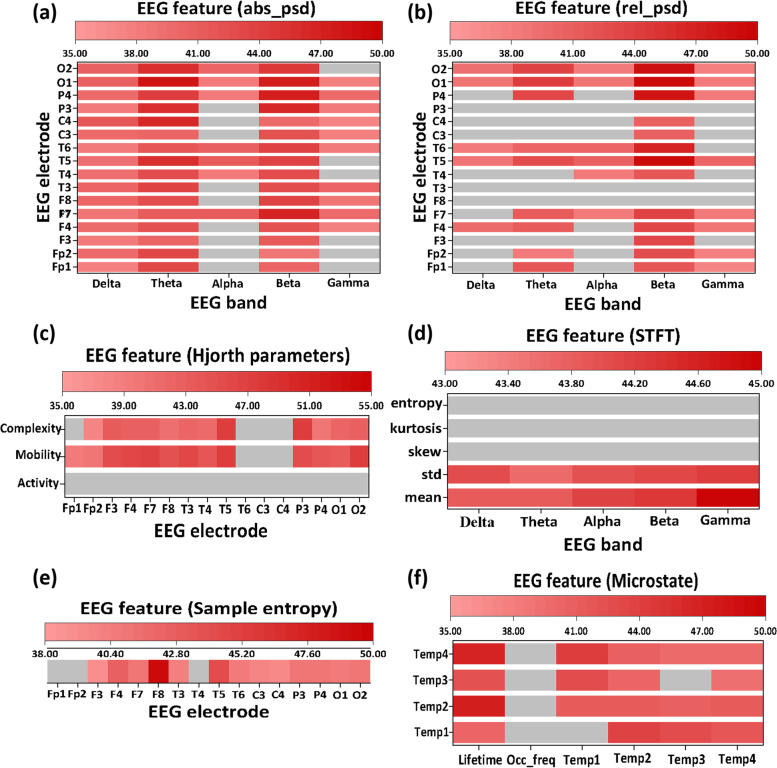
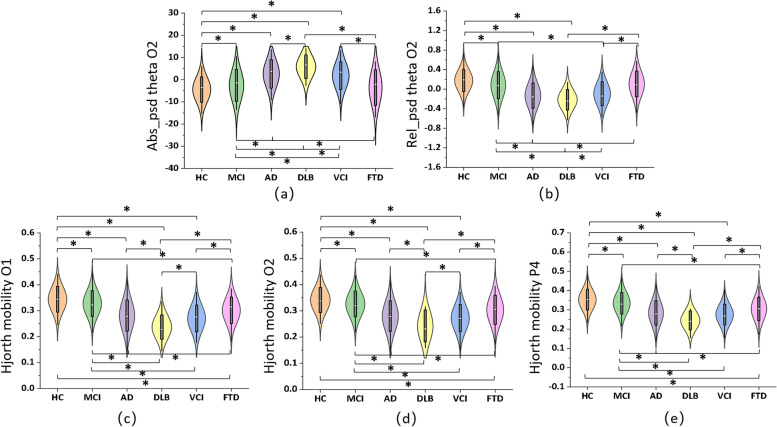
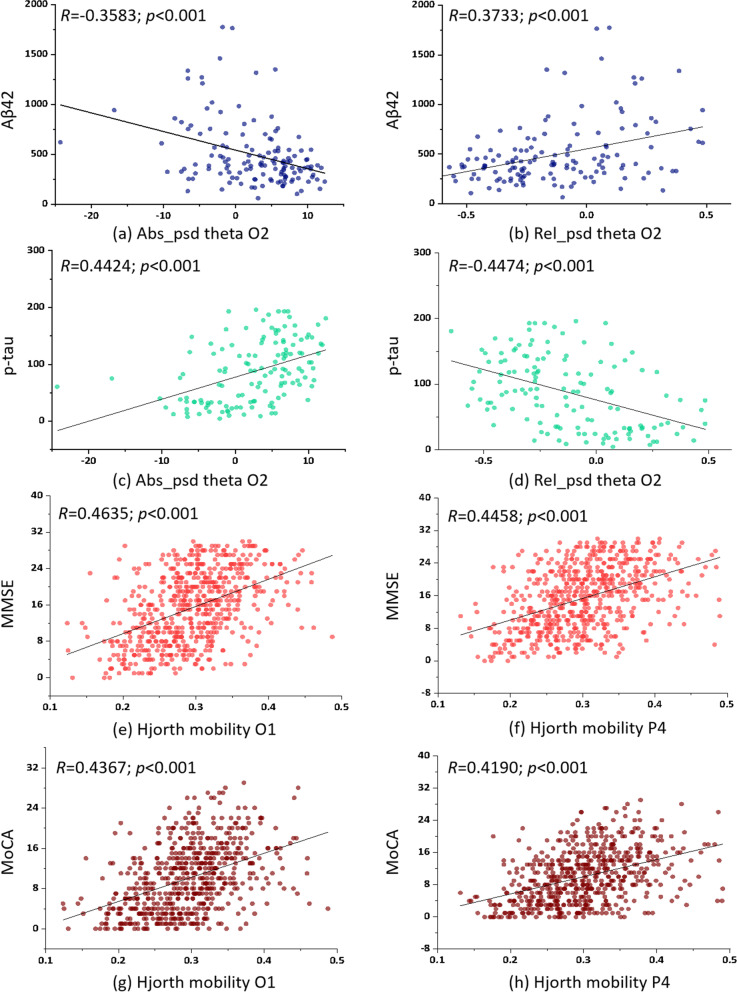
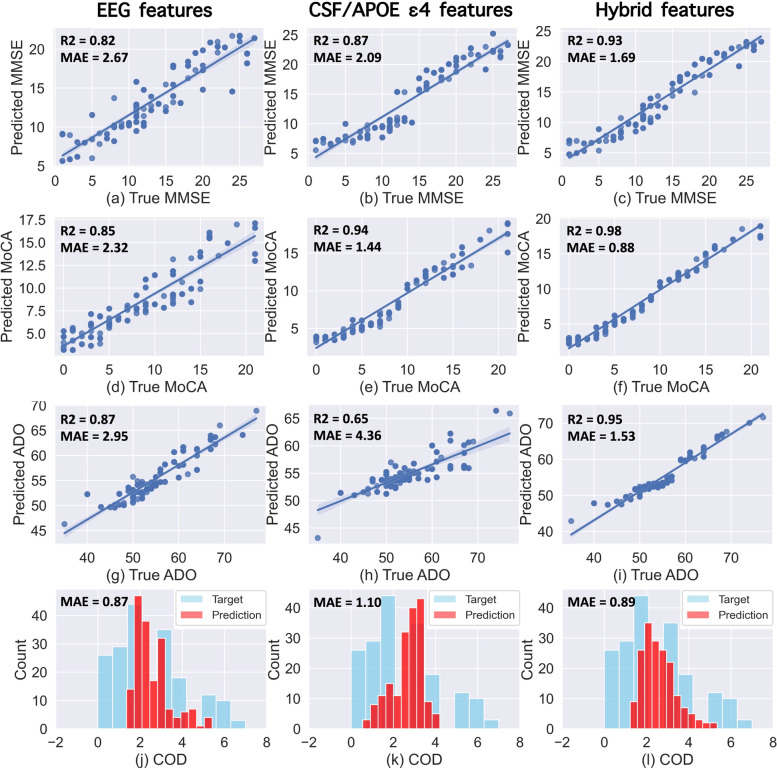
Results: The identified EEG biomarkers achieved over 70% accuracy in the three-level classification of HC, MCI, and AD. Among all six groups, the most prominent effects of AD-linked neurodegeneration on EEG metrics were localized at parieto-occipital regions. In the cross-validation predictive analyses, the optimal EEG features were more effective than the CSF + APOE biomarkers in predicting the age of onset and disease course, whereas the combination of EEG + CSF + APOE measures achieved the best performance for all targets of prediction.
Conclusions: Our study indicates that EEG can be used as a useful screening tool for the diagnosis and disease progression evaluation of MCI and AD.
Keywords: Alzheimer’s disease; Biomarker; Diagnosis; Electroencephalography; Mild cognitive impairment; Prediction.
© 2023. The Author(s).
Conflict of interest statement
The authors declare no competing interests.
Figures
References
-
- Gauthier S, Reisberg B, Zaudig M, Petersen RC, Ritchie K, Broich K, et al. Mild cognitive impairment. Lancet. 2006;367(9518):1262–1270. - PubMed
-
- Petersen RC, Doody R, Kurz A, Mohs RC, Morris JC, Rabins PV, et al. Current concepts in mild cognitive impairment. Arch Neurol. 2001;58(12):1985–1992. - PubMed
-
- Gaubert S, Raimondo F, Houot M, Corsi MC, Naccache L, Diego Sitt J, et al. EEG evidence of compensatory mechanisms in preclinical Alzheimer's disease. Brain. 2019;142(7):2096–2112. - PubMed
Publication types
MeSH terms
Substances
LinkOut - more resources
Full Text Sources
Other Literature Sources
Medical
Miscellaneous
