

GBM Cells Exhibit Susceptibility to Metformin Treatment According to TLR4 Pathway Activation and Metabolic and Antioxidant Status
- PMID: 36765551
- PMCID: PMC9913744
- DOI: 10.3390/cancers15030587
GBM Cells Exhibit Susceptibility to Metformin Treatment According to TLR4 Pathway Activation and Metabolic and Antioxidant Status
Abstract
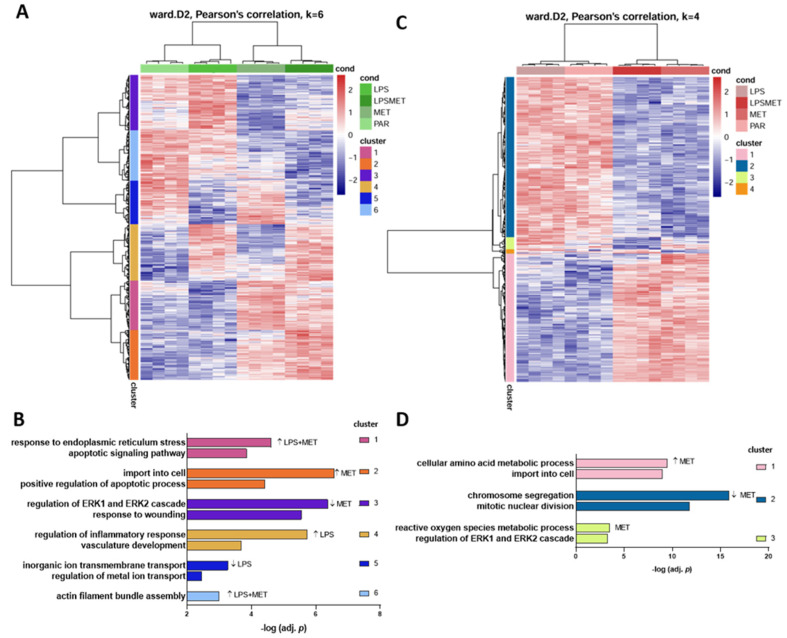
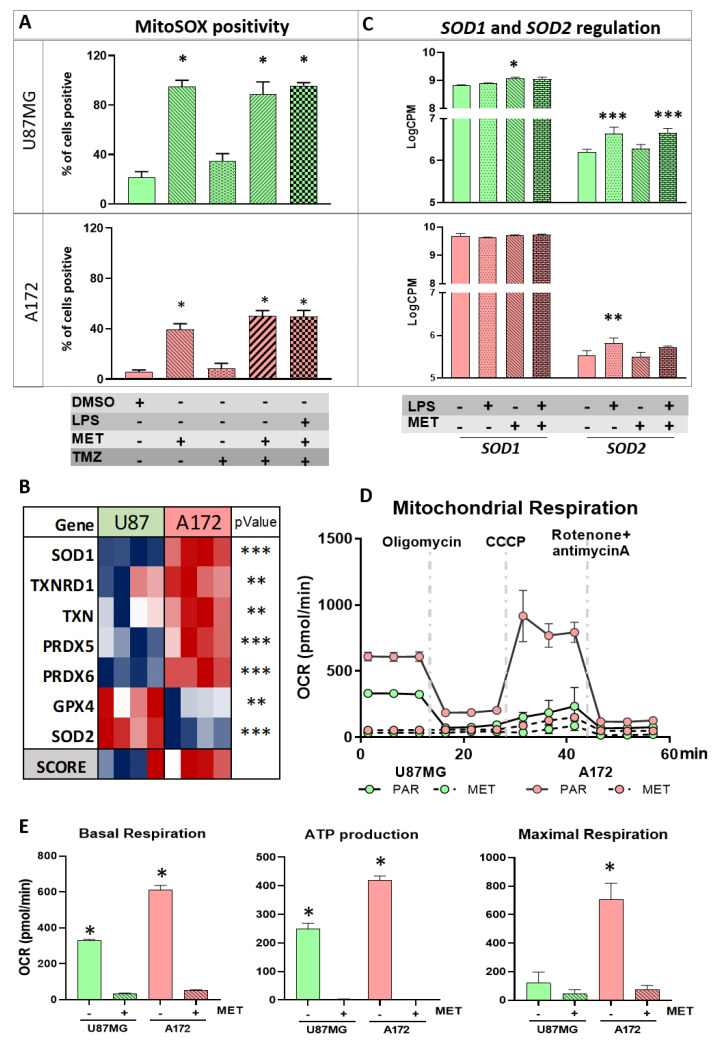
Glioblastoma (GBM) is an aggressive brain cancer associated with poor overall survival. The metabolic status and tumor microenvironment of GBM cells have been targeted to improve therapeutic strategies. TLR4 is an important innate immune receptor capable of recognizing pathogens and danger-associated molecules. We have previously demonstrated the presence of TLR4 in GBM tumors and the decreased viability of the GBM tumor cell line after lipopolysaccharide (LPS) (TLR4 agonist) stimulation. In the present study, metformin (MET) treatment, used in combination with temozolomide (TMZ) in two GBM cell lines (U87MG and A172) and stimulated with LPS was analyzed. MET is a drug widely used for the treatment of diabetes and has been repurposed for cancer treatment owing to its anti-proliferative and anti-inflammatory actions. The aim of the study was to investigate MET and LPS treatment in two GBM cell lines with different metabolic statuses. MET treatment led to mitochondrial respiration blunting and oxidative stress with superoxide production in both cell lines, more markedly in U87MG cells. Decreased cell viability after MET + TMZ and MET + LPS + TMZ treatment was observed in both cell lines. U87MG cells exhibited apoptosis after MET + LPS + TMZ treatment, promoting increased ER stress, unfolded protein response, and BLC2 downregulation. LPS stimulation of U87MG cells led to upregulation of SOD2 and genes related to the TLR4 signaling pathway, including IL1B and CXCL8. A172 cells attained upregulated antioxidant gene expression, particularly SOD1, TXN and PRDX1-5, while MET treatment led to cell-cycle arrest. In silico analysis of the TCGA-GBM-RNASeq dataset indicated that the glycolytic plurimetabolic (GPM)-GBM subtype had a transcriptomic profile which overlapped with U87MG cells, suggesting GBM cases exhibiting this metabolic background with an activated inflammatory TLR4 pathway may respond to MET treatment. For cases with upregulated CXCL8, coding for IL8 (a pro-angiogenic factor), combination treatment with an IL8 inhibitor may improve tumor growth control. The A172 cell line corresponded to the mitochondrial (MTC)-GBM subtype, where MET plus an antioxidant inhibitor, such as anti-SOD1, may be indicated as a combinatory therapy.
Keywords: A172; GBM; LPS; Metformin; U87MG; antioxidant; apoptosis; cell cycle arrest.
Conflict of interest statement
The authors declare no conflict of interest.
Figures


Similar articles
-
Metformin and its potential influence on cell fate decision between apoptosis and senescence in cancer, with a special emphasis on glioblastoma.Front Oncol. 2024 Aug 29;14:1455492. doi: 10.3389/fonc.2024.1455492. eCollection 2024. Front Oncol. 2024. PMID: 39267853 Free PMC article. Review.
-
Late p65 nuclear translocation in glioblastoma cells indicates non-canonical TLR4 signaling and activation of DNA repair genes.Sci Rep. 2021 Jan 14;11(1):1333. doi: 10.1038/s41598-020-79356-1. Sci Rep. 2021. PMID: 33446690 Free PMC article.
-
Exploring the Mechanism of Adjuvant Treatment of Glioblastoma Using Temozolomide and Metformin.Int J Mol Sci. 2022 Jul 25;23(15):8171. doi: 10.3390/ijms23158171. Int J Mol Sci. 2022. PMID: 35897747 Free PMC article.
-
High-Dose Metformin Plus Temozolomide Shows Increased Anti-tumor Effects in Glioblastoma In Vitro and In Vivo Compared with Monotherapy.Cancer Res Treat. 2018 Oct;50(4):1331-1342. doi: 10.4143/crt.2017.466. Epub 2018 Jan 10. Cancer Res Treat. 2018. PMID: 29334602 Free PMC article.
-
Afatinib and Temozolomide combination inhibits tumorigenesis by targeting EGFRvIII-cMet signaling in glioblastoma cells.J Exp Clin Cancer Res. 2019 Jun 18;38(1):266. doi: 10.1186/s13046-019-1264-2. J Exp Clin Cancer Res. 2019. PMID: 31215502 Free PMC article.
Cited by
-
Advances in the treatment of glioma-related signaling pathways and mechanisms by metformin.Front Oncol. 2025 Jan 29;15:1482050. doi: 10.3389/fonc.2025.1482050. eCollection 2025. Front Oncol. 2025. PMID: 39944825 Free PMC article. Review.
-
Overcoming challenges in glioblastoma treatment: targeting infiltrating cancer cells and harnessing the tumor microenvironment.Front Cell Neurosci. 2023 Dec 21;17:1327621. doi: 10.3389/fncel.2023.1327621. eCollection 2023. Front Cell Neurosci. 2023. PMID: 38188666 Free PMC article. Review.
-
Metformin and its potential influence on cell fate decision between apoptosis and senescence in cancer, with a special emphasis on glioblastoma.Front Oncol. 2024 Aug 29;14:1455492. doi: 10.3389/fonc.2024.1455492. eCollection 2024. Front Oncol. 2024. PMID: 39267853 Free PMC article. Review.
-
Potential Molecular Targets in the Treatment of Patients with CNS Tumors.Cancers (Basel). 2023 Jul 27;15(15):3807. doi: 10.3390/cancers15153807. Cancers (Basel). 2023. PMID: 37568623 Free PMC article.
-
Combined metformin and simvastatin therapy inhibits SREBP2 maturation and alters energy metabolism in glioma.Cell Death Dis. 2024 Nov 9;15(11):809. doi: 10.1038/s41419-024-07169-5. Cell Death Dis. 2024. PMID: 39521788 Free PMC article.
References
-
- Louis D.N., Perry A., Wesseling P., Brat D.J., Cree I.A., Figarella-Branger D., Hawkins C., Ng H.K., Pfister S.M., Reifenberger G., et al. The 2021 WHO Classification of Tumors of the Central Nervous System: A summary. Neuro Oncol. 2021;23:1231–1251. doi: 10.1093/neuonc/noab106. - DOI - PMC - PubMed
-
- Stupp R., Mason W.P., van den Bent M.J., Weller M., Fisher B., Taphoorn M.J., Belanger K., Brandes A.A., Marosi C., Bogdahn U., et al. Radiotherapy plus concomitant and adjuvant temozolomide for newly diagnosed glioblastoma. N. Engl. J. Med. 2005;352:987–996. doi: 10.1056/NEJMoa043330. - DOI - PubMed
Grants and funding
- 304541/2020-6/National Council for Scientific and Technological Development
- 307854/2018-3/National Council for Scientific and Technological Development
- 04/12133-6/São Paulo Research Foundation
- 2013/07937-8/São Paulo Research Foundation
- 2020/02988-7/São Paulo Research Foundation
- 2018/18257-1/São Paulo Research Foundation
- 2020/04923-0/São Paulo Research Foundation
- 2021/00140-3/São Paulo Research Foundation
- 23038.018285/2019-21/Coordenação de Aperfeicoamento de Pessoal de Nível Superior
- 88887.600107/2021-00/Coordenação de Aperfeicoamento de Pessoal de Nível Superior
- 062/15/Coordenação de Aperfeicoamento de Pessoal de Nível Superior
- 88887.351607/2019-00/Coordenação de Aperfeicoamento de Pessoal de Nível Superior
- 000/Fundação Faculdade de Medicina
- 000/Hospital das Clínicas da Faculdade de Medicina da Universidade de São Paulo
LinkOut - more resources
Full Text Sources
Miscellaneous
