. 2023 Jan 18;15(3):601.
doi: 10.3390/cancers15030601.

Tumor Growth Suppression of Pancreatic Cancer Orthotopic Xenograft Model by CEA-Targeting CAR-T Cells

Affiliations

Tumor Growth Suppression of Pancreatic Cancer Orthotopic Xenograft Model by CEA-Targeting CAR-T Cells

Osamu Sato et al. Cancers (Basel). .

Abstract

Chimeric antigen receptor engineered T cell (CAR-T) therapy has high therapeutic efficacy against blood cancers, but it has not shown satisfactory results in solid tumors. Therefore, we examined the therapeutic effect of CAR-T therapy targeting carcinoembryonic antigen (CEA) in pancreatic adenocarcinoma (PDAC). CEA expression levels on the cell membranes of various PDAC cell lines were evaluated using flow cytometry and the cells were divided into high, medium, and low expression groups. The relationship between CEA expression level and the antitumor effect of anti-CEA-CAR-T was evaluated using a functional assay for various PDAC cell lines; a significant correlation was observed between CEA expression level and the antitumor effect. We created orthotopic PDAC xenograft mouse models and injected with anti-CEA-CAR-T; only the cell line with high CEA expression exhibited a significant therapeutic effect. Thus, the therapeutic effect of CAR-T therapy was related to the target antigen expression level, and the further retrospective analysis of pathological findings from PDAC patients showed a correlation between the intensity of CEA immunostaining and tumor heterogeneity. Therefore, CEA expression levels in biopsies or surgical specimens can be clinically used as biomarkers to select PDAC patients for anti-CAR-T therapy.

Keywords: adoptive cell therapy; carcinoembryonic antigen; chimeric antigen receptor engineered T cell; orthotopic xenograft mouse model; pancreatic ductal carcinoma.


Conflict of interest statement

The authors declare no relevant conflicts of interest.

Figures

Figure 1
Figure 1
In vivo antigen quantification. (A) Immunofluorescence microscopy was used to detect CEA expression on cell membranes in cell lines. (B) Western blot analysis of whole-cell lysates using the indicated antibody detected the 180 kDa CEA, or anti-βactin antibody as the internal control. (C) Flow cytometry of each cell line tested qualitatively and quantitatively for CEA expression. For each graph, the red curve corresponds to cells, primary anti-CEA antibody, and secondary Alexa Fluor 488 conjugated antibody; the blue curve represents cells and isotype control.
Figure 2
Figure 2
Soluble CEA concentration in cell culture media shows a correlation with the number of CEA molecules.
Figure 3
Figure 3
In vitro functional assays: ELISA. (A) Quantitative measurement of IFN-γ in cell supernatant after co-culture with CAR-T. (B) The secretion levels of IFN-γ were correlated with the number of CEA molecules.  p < 0.05.
Figure 4
Figure 4
In vitro functional assays: Cytotoxicity assay. (A) Cytotoxicity assay with Effector: Target ratio of 10:1 in the presence of soluble CEA at concentrations of 0 ng/mL and 1000 ng/mL. The group without CAR-T was used as the control group. (B) CEA competition assay was performed by adding different recombinant CEA concentrations to the co-culture.  p < 0.05, ※※ p < 0.01.
Figure 5
Figure 5
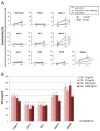
Suppression of transplanted pancreatic carcinoma upon adoptive therapy with anti-CEA-CAR-T. (A) Orthotopic PDAC mouse models were prepared by intrapancreatic injection of CEA (PANC-1), CEA+ (PK-9) or CEA++ (BxPC-3) pancreatic carcinoma cell lines (1× 10⁶ cells/mouse) in NOG mice, each type of cells was marked with luciferase for bioluminescence imaging. When tumors were established, anti-CEA-CAR-T was injected into the tail vein at day 0 (2.5×10⁶ cells/mouse). For comparison, T cells without CAR were injected. Tumor growth was monitored once a week using IVIS imaging. The enhancement of tumor luciferase signal was significantly decreased in only the BxPC-3 model on days 14 and 21. (B) Changes in weight over time. There were no significant weight changes in all groups. (C) Serum levels of cytokines in mice were measured. Pooled serum samples from mice were collected on day 21 and subjected to analysis by cytokine beads arrays. Although cytokine release tended to be higher in the CAR-T group in all models, there were no significant difference of changes in serum levels of cytokines between the CAR-T and NGMC groups.
Figure 6
Figure 6
Histopathological examination of specimens collected from mice. (A) Tissues from orthotopic mouse models treated with anti-CEA-CAR-T or non-modified T cells on day 21 were stained with hematoxylin and eosin and analyzed for CD4, CD8, CK, and CEA expression by antibody staining. (B) Counts of CD8+ T cells infiltrating into the center and peritumor area within the range of 0.25 mm2/field.
Figure 7
Figure 7
Serum level of CEA was measured by ELISA. Pooled serum samples from mice were collected before and after injection of T cells on days 0 and 21.
Figure 8
Figure 8
Immunohistochemical staining for CEA in PDAC patients. (A) CEA staining intensity was categorized into three grades. (B) Heterogeneity was classified into five grades. (C) Analysis of correlation between serum CEA and staining intensity of cell membrane CEA. There was no significant correlation.

References

    1. Gerda E., Jacques F., Niels C., Freddie B., Marianne L.G., Asa K., Jóanis E.K., Elínborg O., Eero P., Hans H.S. NORDCAN—A Nordic tool for cancer information, planning, quality control and research. Acta Oncol. 2010;49:725–736. doi: 10.3109/02841861003782017. - DOI - PubMed
    1. Cielito C.R., Wenyaw C., James L.A., Henry Q.X., Linus H., Douglas B.E., Gauri V., Samrat B., Robert A.W., Christopher C. Patterns of self-reported symptoms in pancreatic cancer patients receiving chemoradiation. J. Pain Symptom. Manag. 2007;34:244–252. doi: 10.1016/j.jpainsymman.2006.11.007. - DOI - PMC - PubMed
    1. Rebecca L., Siegel R.L., Miller K.D., Jemal A. Cancer statistics, 2015. CA Cancer J. Clin. 2015;65:5–29. doi: 10.3322/caac.21254. - DOI - PubMed
    1. Newick K., O’Brien S., Moon E., Albelda S.M. CAR T Cell Therapy for Solid Tumors. Annu. Rev. Med. 2016;68:1–14. doi: 10.1146/annurev-med-062315-120245. - DOI - PubMed
    1. Kawalekar O.U., O’ Connor R.S., Fraietta J.A., Guo L., McGettigan S.E., Posey Jr A.D., Patel P.R., Guedan S., Scholler J., Keith B., et al. Distinct Signaling of Coreceptors Regulates Specific Metabolism Pathways and Impacts Memory Development in CAR T Cells. Immunity. 2016;44:712. doi: 10.1016/j.immuni.2016.02.023. - DOI - PubMed

LinkOut - more resources