

Machine Learning to Predict the Response to Lenvatinib Combined with Transarterial Chemoembolization for Unresectable Hepatocellular Carcinoma
- PMID: 36765583
- PMCID: PMC9913670
- DOI: 10.3390/cancers15030625
Machine Learning to Predict the Response to Lenvatinib Combined with Transarterial Chemoembolization for Unresectable Hepatocellular Carcinoma
Abstract
Background: Lenvatinib and transarterial chemoembolization (TACE) are first-line treatments for unresectable hepatocellular carcinoma (HCC), but the objective response rate (ORR) is not satisfactory. We aimed to predict the response to lenvatinib combined with TACE before treatment for unresectable HCC using machine learning (ML) algorithms based on clinical data.
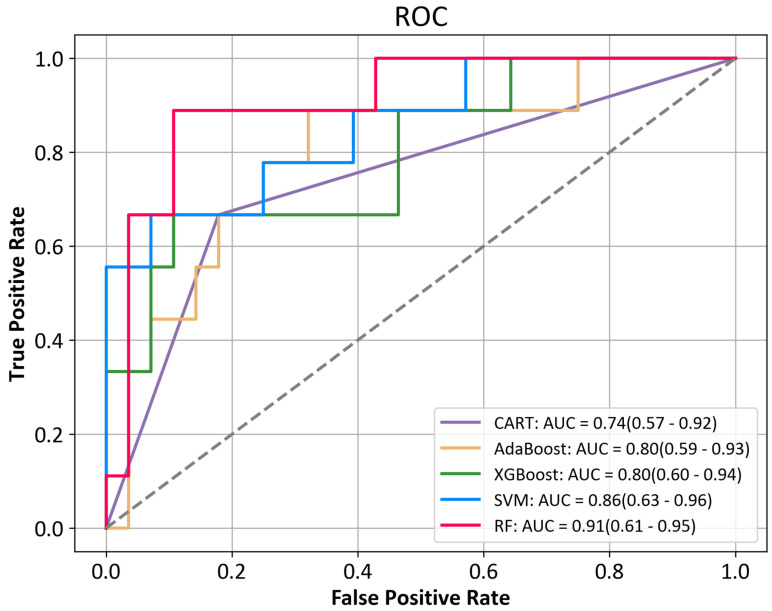
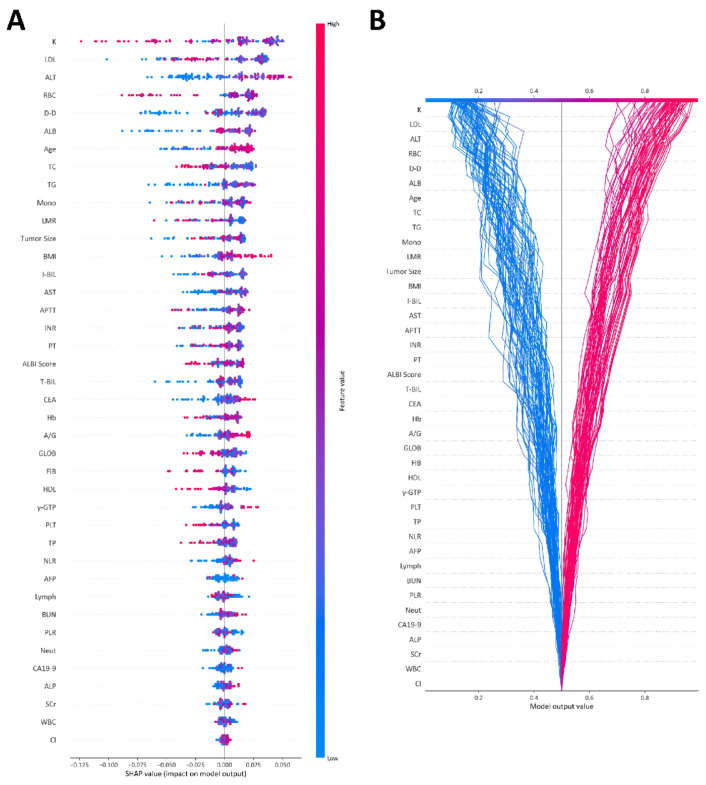
Methods: Patients with unresectable HCC receiving the combination therapy of lenvatinib combined with TACE from two medical centers were retrospectively collected from January 2020 to December 2021. The response to the combination therapy was evaluated over the following 4-12 weeks. Five types of ML algorithms were applied to develop the predictive models, including classification and regression tree (CART), adaptive boosting (AdaBoost), extreme gradient boosting (XGBoost), random forest (RF), and support vector machine (SVM). The performance of the models was assessed by the receiver operating characteristic (ROC) curve and area under the receiver operating characteristic curve (AUC). The Shapley Additive exPlanation (SHAP) method was applied to explain the model.
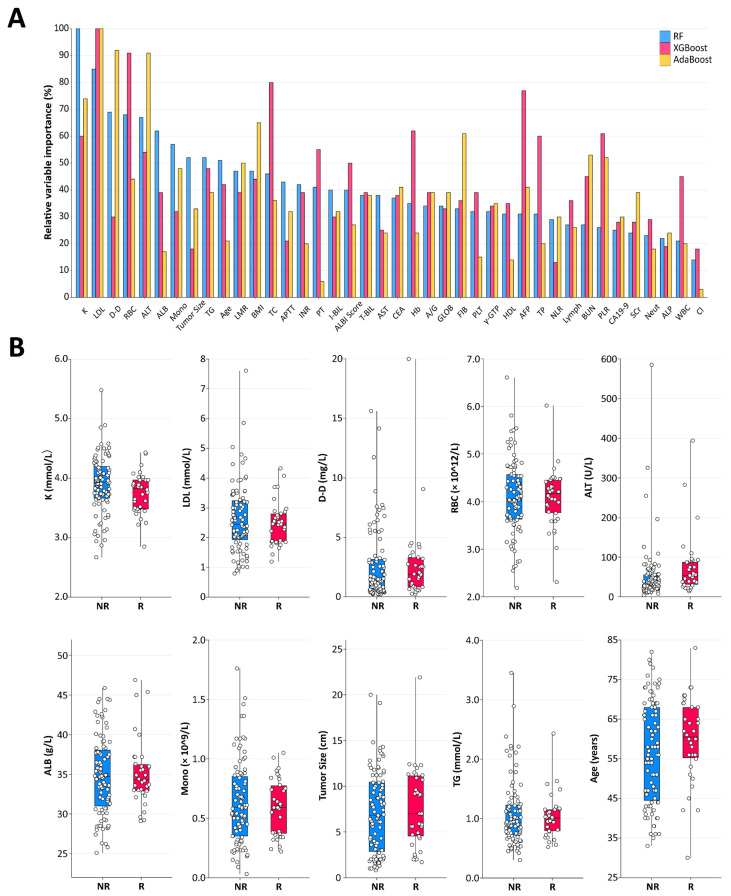
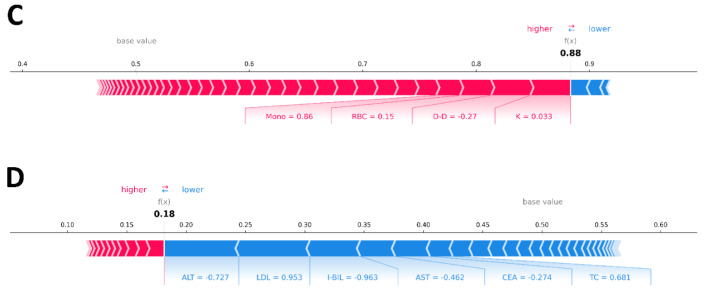
Results: A total of 125 unresectable HCC patients were included in the analysis after the inclusion and exclusion criteria, among which 42 (33.6%) patients showed progression disease (PD), 49 (39.2%) showed stable disease (SD), and 34 (27.2%) achieved partial response (PR). The nonresponse group (PD + SD) included 91 patients, while the response group (PR) included 34 patients. The top 40 most important features from all 64 clinical features were selected using the recursive feature elimination (RFE) algorithm to develop the predictive models. The predictive power was satisfactory, with AUCs of 0.74 to 0.91. The SVM model and RF model showed the highest accuracy (86.5%), and the RF model showed the largest AUC (0.91, 95% confidence interval (CI): 0.61-0.95). The SHAP summary plot and decision plot illustrated the impact of the top 40 features on the efficacy of the combination therapy, and the SHAP force plot successfully predicted the efficacy at the individualized level.
Conclusions: A new predictive model based on clinical data was developed using ML algorithms, which showed favorable performance in predicting the response to lenvatinib combined with TACE for unresectable HCC. Combining ML with SHAP could provide an explicit explanation of the efficacy prediction.
Keywords: Shapley Additive exPlanation; hepatocellular carcinoma; lenvatinib; machine learning; transarterial chemoembolization; treatment response.
Conflict of interest statement
The authors have no relevant financial or nonfinancial interest to disclose.
Figures

Similar articles
-
Prognosis prediction and risk stratification of transarterial chemoembolization or intraarterial chemotherapy for unresectable hepatocellular carcinoma based on machine learning.Eur Radiol. 2024 Aug;34(8):5094-5107. doi: 10.1007/s00330-024-10581-2. Epub 2024 Jan 30. Eur Radiol. 2024. PMID: 38291256 Free PMC article.
-
MRI Radiomics to Predict Early Treatment Response to TACE Combined with Lenvatinib Plus a PD-1 Inhibitor for Hepatocellular Carcinoma with Portal Vein Tumor Thrombus.J Hepatocell Carcinoma. 2025 May 16;12:985-998. doi: 10.2147/JHC.S513696. eCollection 2025. J Hepatocell Carcinoma. 2025. PMID: 40406667 Free PMC article.
-
Prediction of Early Treatment Response to Initial Conventional Transarterial Chemoembolization Therapy for Hepatocellular Carcinoma by Machine-Learning Model Based on Computed Tomography.J Hepatocell Carcinoma. 2021 Nov 30;8:1473-1484. doi: 10.2147/JHC.S334674. eCollection 2021. J Hepatocell Carcinoma. 2021. PMID: 34877267 Free PMC article.
-
Lenvatinib plus transarterial chemoembolization with or without immune checkpoint inhibitors for unresectable hepatocellular carcinoma: A review.Front Oncol. 2022 Sep 28;12:980214. doi: 10.3389/fonc.2022.980214. eCollection 2022. Front Oncol. 2022. PMID: 36249023 Free PMC article. Review.
-
The efficacy of transarterial chemoembolization in downstaging unresectable hepatocellular carcinoma to curative therapy: a predicted regression model.Invest New Drugs. 2022 Oct;40(5):1146-1152. doi: 10.1007/s10637-022-01261-3. Epub 2022 Jun 20. Invest New Drugs. 2022. PMID: 35723760 Review.
Cited by
-
Gadoxetic acid-enhanced MRI for identifying cholangiocyte phenotype hepatocellular carcinoma by interpretable machine learning: individual application of SHAP.BMC Cancer. 2025 Apr 28;25(1):788. doi: 10.1186/s12885-025-14147-3. BMC Cancer. 2025. PMID: 40295993 Free PMC article.
-
Classification and Regression Trees to Predict for Survival for Patients With Hepatocellular Carcinoma Treated With Atezolizumab and Bevacizumab.JCO Clin Cancer Inform. 2024 Aug;8:e2300220. doi: 10.1200/CCI.23.00220. JCO Clin Cancer Inform. 2024. PMID: 39088775 Free PMC article.
-
Research progress on machine algorithm prediction of liver cancer prognosis after intervention therapy.Am J Cancer Res. 2024 Sep 25;14(9):4580-4596. doi: 10.62347/BEAO1926. eCollection 2024. Am J Cancer Res. 2024. PMID: 39417194 Free PMC article. Review.
-
MRI radiomics for diagnosing small BI-RADS 4 breast lesions: an interpretable model.Quant Imaging Med Surg. 2025 Jun 6;15(6):5060-5072. doi: 10.21037/qims-24-1893. Epub 2025 May 23. Quant Imaging Med Surg. 2025. PMID: 40606393 Free PMC article.
-
The Role of Artificial Intelligence in the Detection and Implementation of Biomarkers for Hepatocellular Carcinoma: Outlook and Opportunities.Cancers (Basel). 2023 May 26;15(11):2928. doi: 10.3390/cancers15112928. Cancers (Basel). 2023. PMID: 37296890 Free PMC article. Review.
References
-
- Zhang X.F., Beal E.W., Bagante F., Chakedis J., Weiss M., Popescu I., Marques H.P., Aldrighetti L., Maithel S.K., Pulitano C., et al. Early versus late recurrence of intrahepatic cholangiocarcinoma after resection with curative intent. Br. J. Surg. 2018;105:848–856. doi: 10.1002/bjs.10676. - DOI - PubMed
Grants and funding
LinkOut - more resources
Full Text Sources
Research Materials
Miscellaneous
