. 2023 Feb 2;15(3):962.
doi: 10.3390/cancers15030962.

Attrition Rates in Multiple Myeloma Treatment under Real World Conditions-An Analysis from the Austrian Myeloma Registry (AMR)

Affiliations

Attrition Rates in Multiple Myeloma Treatment under Real World Conditions-An Analysis from the Austrian Myeloma Registry (AMR)

Magdalena A Benda et al. Cancers (Basel). .

Abstract

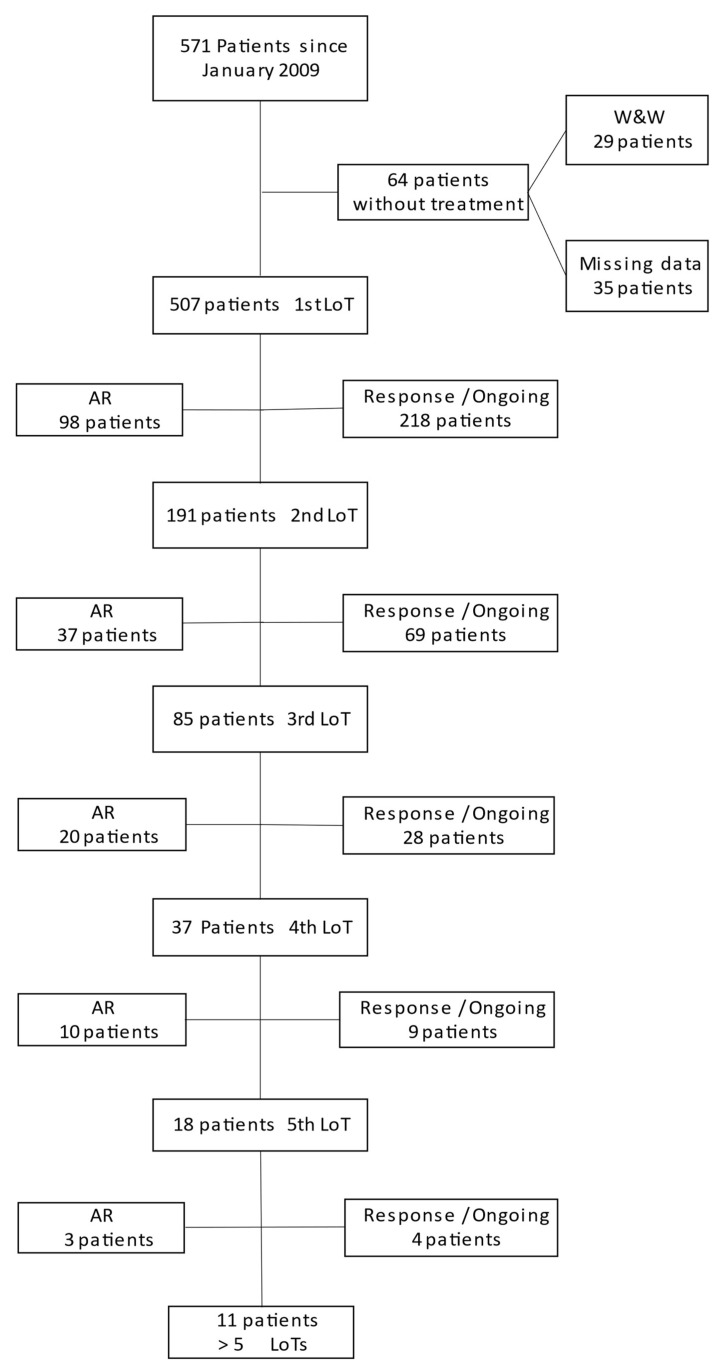
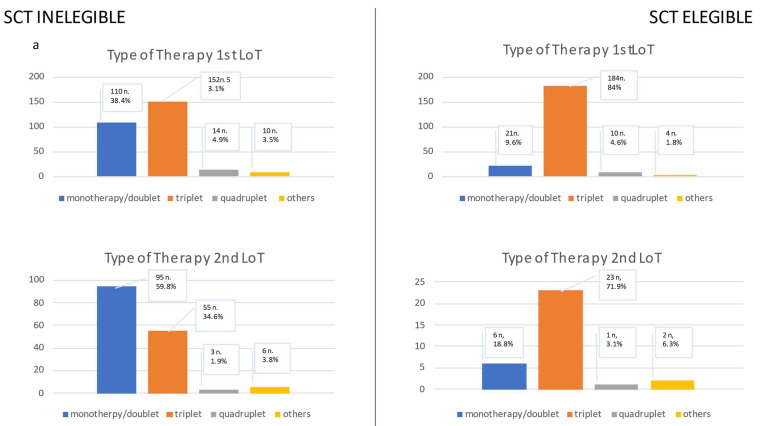
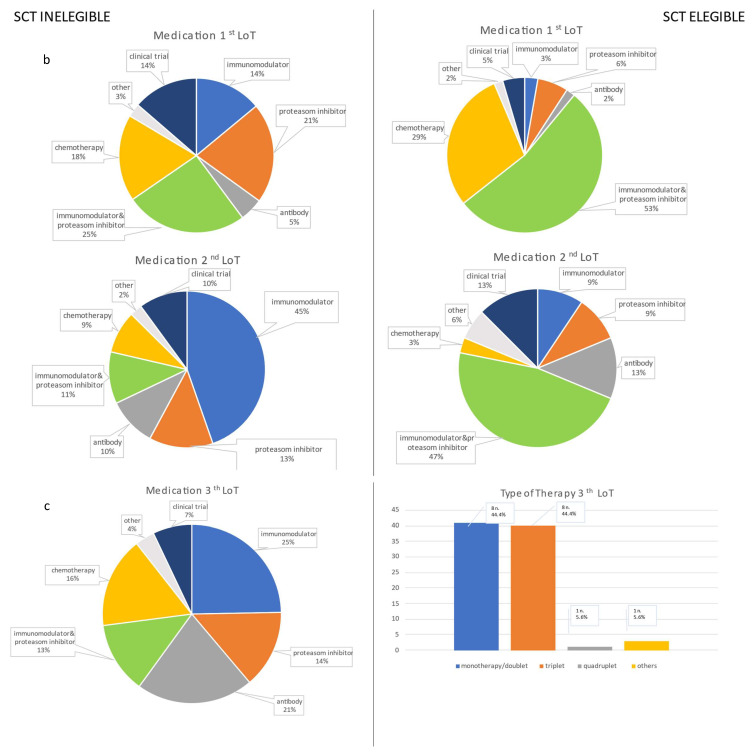
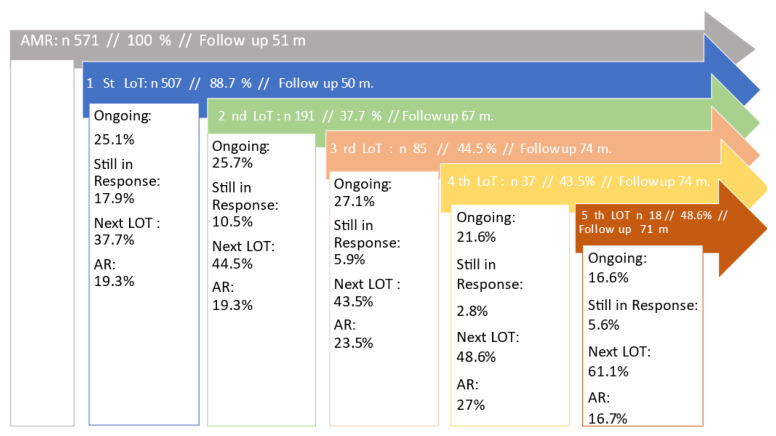
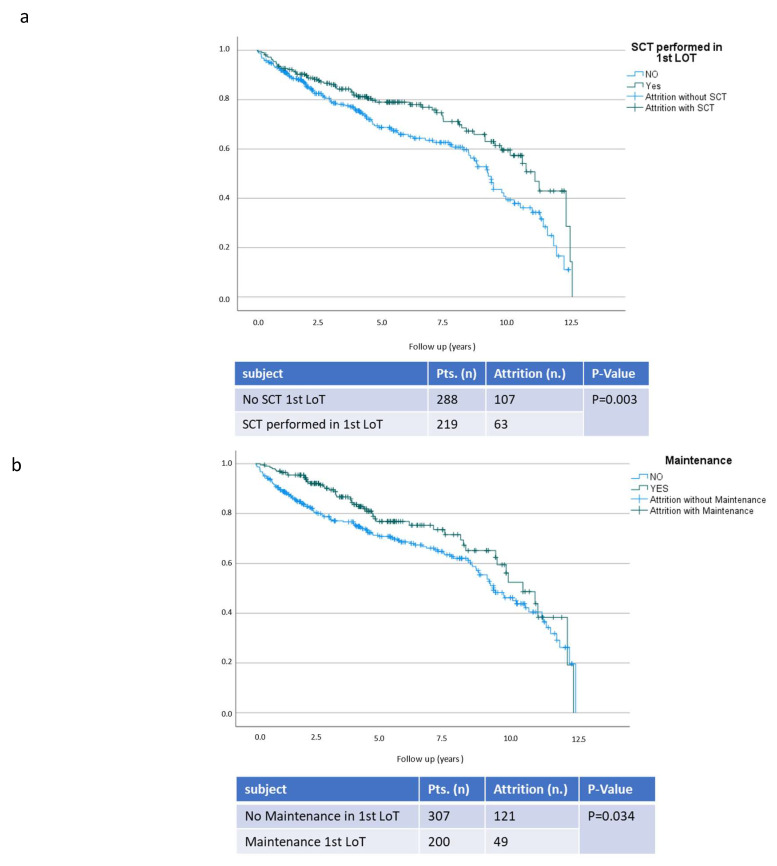
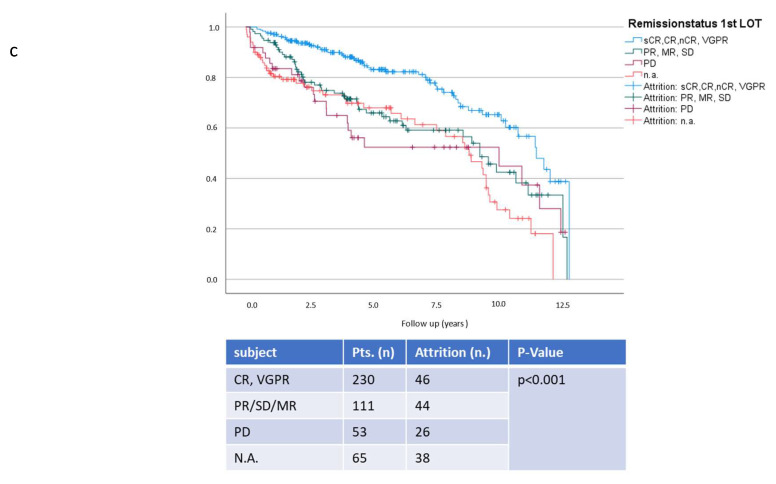
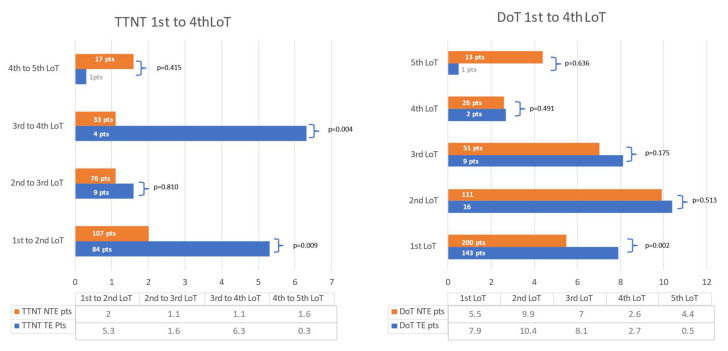
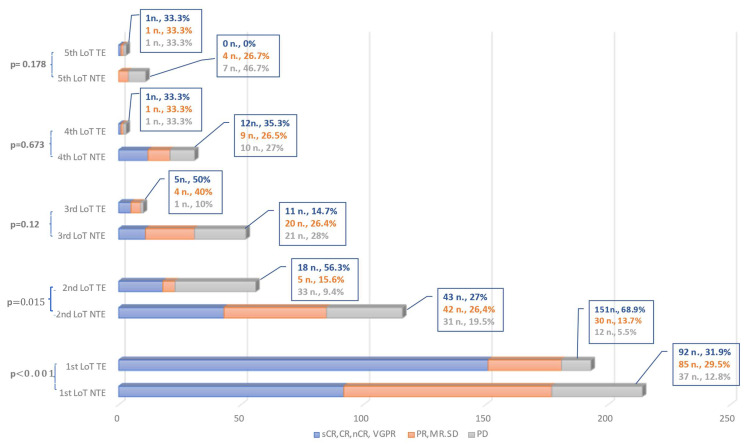
Multiple myeloma (MM) is characterized by serial relapses, necessitating the application of sequential lines of therapy (LoT). Reports on attrition rates (ARs) vary widely. The present study analysed ARs from the Austrian Myeloma Registry. Attrition was defined as being either deceased, progressive without having received another LoT, or lack of follow-up for ≥5 years. A total of 571 patients diagnosed between January 2009 and August 2021 were included (median age: 72 years; median follow-up: 50.8 months). Some 507 patients received at least one LoT. Of the total, 43.6% underwent autologous stem cell transplantation (SCT, transplant eligible = TE)) with primarily VRd (Bortezomib/Lenalidomide/Dexamethasone) given as induction (26.5%), followed by lenalidomide maintenance in 55.7% of cases. Transplant-ineligible (NTE) patients were predominantly treated with Vd (Bortezomib/Dexamethasone, 21.6%), receiving maintenance in 27.1%. A total of 37.5% received a second LoT. ARs across one to five LoTs were 16.7-27%. Frontline induction/ SCT followed by maintenance reduced ARs associated with age and achievement of deep remission in the frontline. Deep remission prolongs follow-up and time-to-next-treatment (TTNT), while high-risk-cyctogenetics negatively affected these outcomes. Our results demonstrate considerably lower ARs for MM patients within the AMR data versus other healthcare systems. Young age and the achievement of significant remissions after optimal frontline therapy resulted in particularly low ARs. These promising results support a key role for the ease of drug access and reimbursement policies in governing long-term MM patient outcomes.

Keywords: attrition rate; multiple myeloma; treatment patterns.


Conflict of interest statement

The authors declare that they have no conflicts of interest.

Figures

Figure 1
Figure 1
Consort Diagram. The number of patients from the beginning to the 5th line of therapy (LoT) is presented. The attrition rate (AR) is given on the left side of the diagram. Patients under treatment (ongoing) or without treatment but still in response (response) are listed on the right side for each LoT. The number of patients who have entered the subsequent LoT are displayed under each LoT.
Figure 2
Figure 2
This figure presents (a) the type of therapy in the first line of therapy (LoT) and the second LoT. The type of therapy is divided into monotherapy and doublet, triplet, quadruplet or other regimens. The second figure (b) shows the type of medication in the first and second LoT. The medications are classified into the following groups: immunomodulators, proteasome inhibitors, Ps and proteasome inhibitors, chemotherapy, antibody, clinical trial, or others. In (a,b), patients are categorized into two groups: those eligible for transplantation (SCT Eligible) and those ineligible for SCT (SCT Ineligible). In the last figure (c), the type of medication and therapy is given for all patients in the third LoT as one group due to the limited number of patients.
Figure 2
Figure 2
This figure presents (a) the type of therapy in the first line of therapy (LoT) and the second LoT. The type of therapy is divided into monotherapy and doublet, triplet, quadruplet or other regimens. The second figure (b) shows the type of medication in the first and second LoT. The medications are classified into the following groups: immunomodulators, proteasome inhibitors, Ps and proteasome inhibitors, chemotherapy, antibody, clinical trial, or others. In (a,b), patients are categorized into two groups: those eligible for transplantation (SCT Eligible) and those ineligible for SCT (SCT Ineligible). In the last figure (c), the type of medication and therapy is given for all patients in the third LoT as one group due to the limited number of patients.
Figure 3
Figure 3
The diagram shows the number of patients in each line of therapy (LoT) from the first to the fifth LoT. Follow-up is the presenting time from date of first diagnosis to the date of last contact or data collection. The percentage given refers to the total number of the previous LOTs. The number of patients who are still receiving treatment is referred to as “ongoing” and given in percentage (%) relating to the number of patients in the present LoT. Patients who do not receive further therapy without the disease progressing are labelled as “In Response” (%). Patients who enter the next LoT are termed “next LOT” (%). “Attrition Rate” (AR %) includes deceased patients and patients lost to follow up who are either documented or detected during data cleaning.
Figure 4
Figure 4
Propensity of survival without attrition in respect to stem cell transplantation, (a) maintenance, (b) and remission status (c). This figure presents follow-up in years and propensity of survival without attrition. On the top, patients with performed transplantation (SCT) in the first LoT are presented in comparison to transplant ineligible patients (No SCT). In the middle the difference in propensity of survival without attrition is displayed comparing patients with and without maintenance in frontline treatment. In the last diagram the propensity of survival without attrition is presented comparing patients in different remission status after the first LoT. Very good partial responses or better are presented (VGPR) in one group. Patients with partial response (PR), minimal response (MR) and stable disease (SD) are categorised in another group. Patients with progressive disease (PD) are presented separately from patients without noted remission status (n.a.).
Figure 4
Figure 4
Propensity of survival without attrition in respect to stem cell transplantation, (a) maintenance, (b) and remission status (c). This figure presents follow-up in years and propensity of survival without attrition. On the top, patients with performed transplantation (SCT) in the first LoT are presented in comparison to transplant ineligible patients (No SCT). In the middle the difference in propensity of survival without attrition is displayed comparing patients with and without maintenance in frontline treatment. In the last diagram the propensity of survival without attrition is presented comparing patients in different remission status after the first LoT. Very good partial responses or better are presented (VGPR) in one group. Patients with partial response (PR), minimal response (MR) and stable disease (SD) are categorised in another group. Patients with progressive disease (PD) are presented separately from patients without noted remission status (n.a.).
Figure 5
Figure 5
This figure presents the time to the next treatment/treatment free period (TTNT) and time of treatment (DoT) from the first to the fifth line of therapy (LoT) given as a median in months. The DoT is defined as the time from start of therapy to the end date, including stem-cell transplant and maintenance. TTNT is the time without treatment from the end date of a previous LoT to the start date of the subsequent LoT. A comparison of transplant eligible (TE) patients and transplant- ineligible (NTE) patients is displayed across the LoTs. The amount of patients analysed are given in each bar. Missing data is recorded with respect to each LoT in DoT: first LoT 37 patients, second LoT 15 patients, third LoT two patients, fourth LoT one patient, fifth LoT one patient.
Figure 6
Figure 6
Depiction of the achieved depth of remission from the first to the fifth line of therapy (LoT). For coherence, the remission status has been categorized as very good partial response (VGPR) or better in one group and stable disease (SD), minimal response (MR) and partial response (PR) in another group. Progressive disease (PD) is listed separately. The difference between transplant-eligible (TE) and transplant-ineligible (NTE) patients is displayed for each LoT. On the right side, the number of patients and the percentage of each group is given in the same color as in the graph. The p-value on the left side indicates the significance in chi-square testing between TE and NTE patients.

References

    1. Dimopoulos M.A., Moreau P., Terpos E., Mateos M.V., Zweegman S., Cook G., Delforge M., Hájek R., Schjesvold F., Cavo M., et al. Multiple myeloma: EHA-ESMO Clinical Practice Guidelines for diagnosis, treatment and follow-up†. Ann. Oncol. 2021;32:309–322. doi: 10.1016/j.annonc.2020.11.014. - DOI - PubMed
    1. Bethesda: National Cancer Institute SEER Cancer Stat Facts: Myeloma. [(accessed on 16 January 2022)]; Available online: https://seer.cancer.gov/statfacts/html/mulmy.html.
    1. Fonseca R., Usmani S.Z., Mehra M., Slavcev M., He J., Cote S., Lam A., Ukropec J., Maiese E.M., Nair S., et al. Frontline treatment patterns and attrition rates by subsequent lines of therapy in patients with newly diagnosed multiple myeloma. BMC Cancer. 2020;20:1087. doi: 10.1186/s12885-020-07503-y. - DOI - PMC - PubMed
    1. Yong K., Delforge M., Driessen C., Fink L., Flinois A., Gonzalez-McQuire S., Safaei R., Karlin L., Mateos M.-V., Raab M.S., et al. Multiple myeloma: Patient outcomes in real-world practice. Br. J. Haematol. 2016;175:252–264. doi: 10.1111/bjh.14213. - DOI - PMC - PubMed
    1. Jagannath S., Joseph N., He J., Crivera C., Fu A.Z., Garret A., Shah N. Healthcare Costs Incurred by Patients with Multiple Myeloma Following Triple Class Exposure (TCE) in the US. Oncol. Ther. 2021;9:659–669. doi: 10.1007/s40487-021-00175-z. - DOI - PMC - PubMed