

Identification of Illicit Conservation Treatments in Fresh Fish by Micro-Raman Spectroscopy and Chemometric Methods
- PMID: 36765978
- PMCID: PMC9913940
- DOI: 10.3390/foods12030449
Identification of Illicit Conservation Treatments in Fresh Fish by Micro-Raman Spectroscopy and Chemometric Methods
Abstract
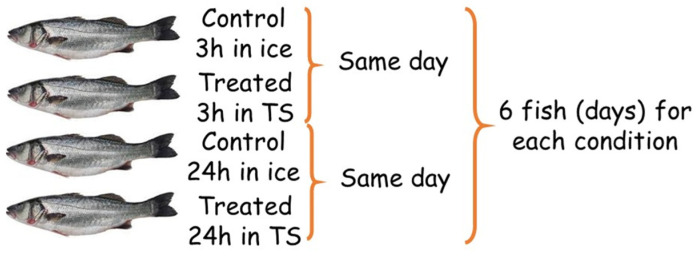
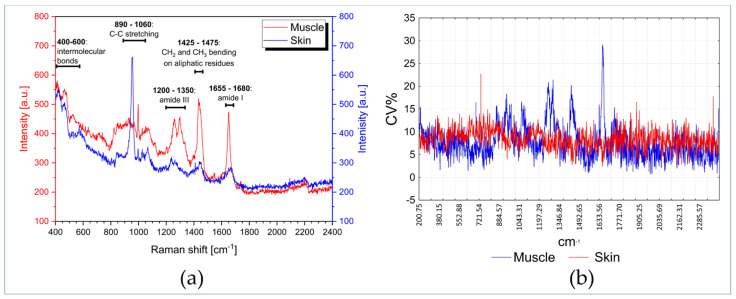
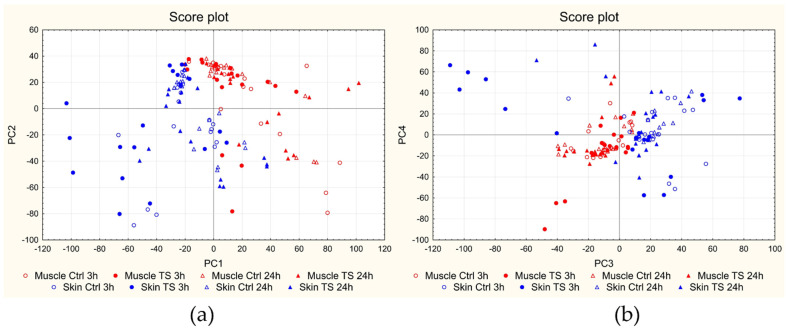
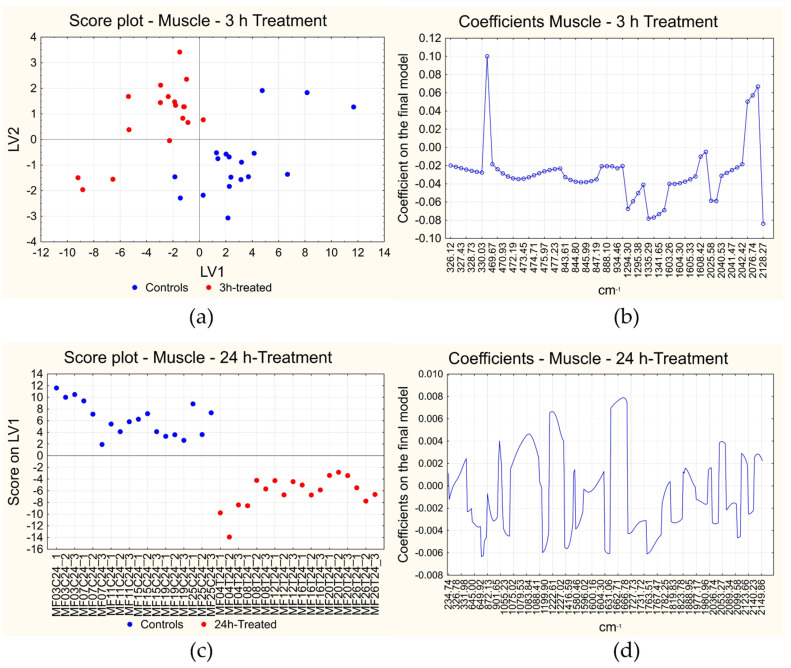
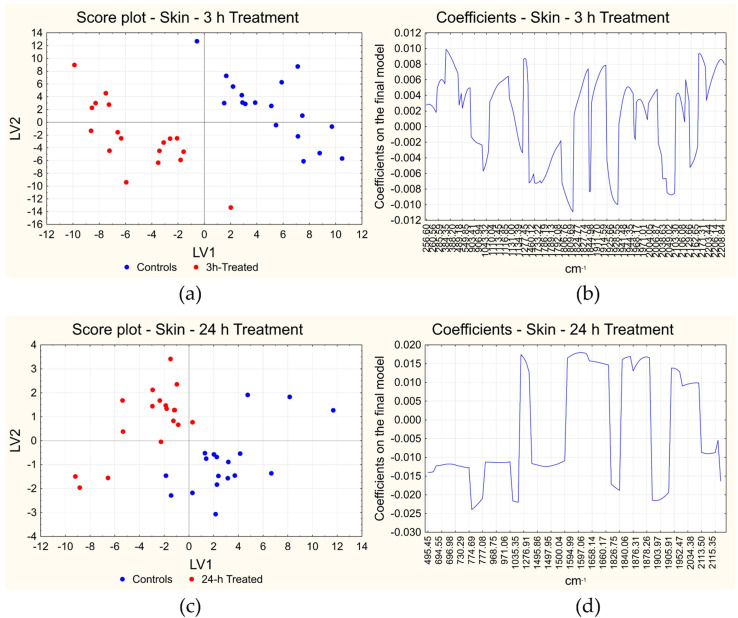
In the field of food control for fresh products, the identification of foods subjected to illicit conservation treatments to extend their shelf life is fundamental. Fresh fish products are particularly subjected to this type of fraud due to their high commercial value and the fact that they often have to be transported over a long distance, keeping their organoleptic characteristics unaltered. Treatments of this type involve, e.g., the bleaching of the meat and/or the momentary abatement of the microbial load, while the degradation process continues. It is therefore important to find rapid methods that allow the identification of illicit treatments. The study presented here was performed on 24 sea bass samples divided into four groups: 12 controls (stored on ice in the fridge for 3 or 24 h), and 12 treated with a Cafodos-like solution for 3 or 24 h. Muscle and skin samples were then characterized using micro-Raman spectroscopy. The data were pre-processed by smoothing and taking the first derivative and then PLS-DA models were built to identify short- and long- term effects on the fish's muscle and skin. All the models provided the perfect classification of the samples both in fitting and cross-validation and an analysis of the bands responsible for the effects was also reported. To the best of the authors' knowledge, this is the first time Raman spectroscopy has been applied for the identification of a Cafodos-like illicit treatment, focusing on both fish muscle and skin evaluation. The procedure could pave the way for a future application directly on the market through the use of a portable device.
Keywords: Cafodos-like treatment; PLS-DA; chemometrics; food preservation; fresh sea bass; micro-Raman; muscle and skin.
Conflict of interest statement
The authors declare no conflict of interest.
Figures
References
-
- FAO . The State of World Fisheries and Aquaculture 2022. Towards Blue Transformation. FAO; Rome, Italy: 2022. - DOI
-
- FAO . The State of World Fisheries and Aquaculture 2020. Sustainability in Action. FAO; Rome, Italy: 2020. 244p. - DOI
-
- Reilly A. Overview of Food Fraud in the Fisheries Sector. FAO Fisheries and Aquaculture Circular; Rome, Italy: 2018.
-
- Donlan C.J., Luque G.M. Exploring the Causes of Seafood Fraud: A Meta-Analysis on Mislabeling and Price. Mar. Policy. 2019;100:258–264. doi: 10.1016/j.marpol.2018.11.022. - DOI
-
- Giusti A., Malloggi C., Tinacci L., Nucera D., Armani A. Mislabeling in Seafood Products Sold on the Italian Market: A Systematic Review and Meta-Analysis. Food Control. 2023;145:109395. doi: 10.1016/j.foodcont.2022.109395. - DOI
Grants and funding
LinkOut - more resources
Full Text Sources
