. 2023 Jan 17;12(3):352.
doi: 10.3390/cells12030352.

Proteoglycan SPOCK1 as a Poor Prognostic Marker Promotes Malignant Progression of Clear Cell Renal Cell Carcinoma via Triggering the Snail/Slug-MMP-2 Axis-Mediated Epithelial-to-Mesenchymal Transition

Affiliations

Proteoglycan SPOCK1 as a Poor Prognostic Marker Promotes Malignant Progression of Clear Cell Renal Cell Carcinoma via Triggering the Snail/Slug-MMP-2 Axis-Mediated Epithelial-to-Mesenchymal Transition

Yung-Wei Lin et al. Cells. .

Abstract

Sparc/osteonectin, cwcv, and kazal-like domains proteoglycan 1 (SPOCK1) has been reported to play an oncogenic role in certain cancer types; however, the role of SPOCK1 in the progression of clear cell renal cell carcinoma (ccRCC) remains elusive. Here, higher SPOCK1 transcript and protein levels were observed in ccRCC tissues compared to normal tissues and correlated with advanced clinical stages, larger tumor sizes, and lymph node and distal metastases. Knockdown and overexpression of SPOCK1 in ccRCC cells led to decreased and increased cell clonogenic and migratory/invasive abilities in vitro as well as lower and higher tumor growth and invasion in vivo, respectively. Mechanistically, the gene set enrichment analysis (GSEA) database was used to identify the gene set of epithelial-to-mesenchymal transition (EMT) pathways enriched in ccRCC samples with high SPOCK1 expression. Further mechanistic investigations revealed that SPOCK1 triggered the Snail/Slug-matrix metalloproteinase (MMP)-2 axis to promote EMT and cell motility. Clinical ccRCC samples revealed SPOCK1 to be an independent prognostic factor for overall survival (OS), and positive correlations of SPOCK1 with MMP-2 and mesenchymal-related gene expression levels were found. We observed that patients with SPOCK1high/MMP2high tumors had the shortest OS times compared to others. In conclusion, our findings reveal that SPOCK1 can serve as a useful biomarker for predicting ccRCC progression and prognosis, and as a promising target for treating ccRCC.

Keywords: SPOCK1; clear cell renal cell carcinoma; epithelial-to-mesenchymal transition; matrix metalloproteinase-2; metastasis; snail/slug.


Conflict of interest statement

The authors declare no conflict of interest.

Figures
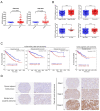
Figure 1
Figure 1
Clinical significance of SPOCK1 in clear cell renal cell carcinoma (RCC; ccRCC). (A) SPOCK1 gene expression levels in RCC specimens (n = 69), ccRCC specimens (n = 32), and normal tissue samples (n = 23) were measured by Affymetrix oligonucleotide arrays obtained from the GEO (GSE15641). (B) SPOCK1 gene expression levels in ccRCC samples from TCGA were compared according to the clinical stage, tumor size (T stage), lymph node metastasis (N stage), and distal metastasis (M stage). Statistical significance was analyzed by a t-test. * p < 0.05, *** p < 0.001. (C) Kaplan–Meier curves for survival of patients with ccRCC or papillary (p)RCC, as categorized according to high or low expression of SPOCK1. The p value indicates a comparison between patients with SPOCK1high and SPOCK1low. The ccRCC and pRCC datasets were retrieved from TCGA. (D) SPOCK1 protein expression levels in ccRCC specimens and adjacent normal tissue samples or benign tumor (oxyphilic adenoma) samples were measured by IHC staining. The right panels are the enlarged images of left panels. Scale bars of left panel and right panel are 200 and 100 µM, respectively.
Figure 2
Figure 2
SPOCK1 overexpression promotes the proliferation, clonogenicity, migration, and invasion of clear cell renal cell carcinoma (ccRCC) cells. (A) Endogenous SPOCK1 protein levels were detected using a Western blot analysis of ccRCC (Caki-1 and 786-O) and papillary (p)RCC (ACHN and Caki-2) cells. (B) The migratory ability of ccRCC and pRCC cells was examined by a transwell migration assay. (C) Knockdown efficiencies of three SPOCK1 shRNAs were determined by Western blotting in Caki-1 and 786-O cells. (D) Migratory abilities of SPOCK1-KD Caki-1 and 786-O cells were evaluated by a transwell migration assay. (E) SPOCK1 was overexpressed in Caki-1 and 786-O cells as determined by Western blotting. (F) Invasive abilities of SPOCK1-overexpressing Caki-1 and 786-O cells were determined by a Matrigel invasion assay. (D,F) Left panel: representative photomicrographs. Right panel: Data are presented as the mean ± SD of three independent experiments. *** p < 0.001, compared to control cells. (G,H) Proliferation rates and colony-forming abilities of SPOCK1-manipulated Caki-1 and 786-O cells were measured by performing MTS (G) and colony-formation (H) assays, respectively. Left panel of (H): representative photomicrographs. Data from (G) and (H) are presented as the mean ± SD of three independent experiments. * p < 0.05, ** p < 0.01, *** p < 0.001, compared to control cells.
Figure 3
Figure 3
SPOCK1 promotes the epithelial-to-mesenchymal transition (EMT) in clear cell renal cell carcinoma (ccRCC) cells. (A) The gene set enrichment analysis (GSEA) was carried out using Hallmark gene sets from the Molecular Signature Database (http://software.broadinstitute.org/gsea/msigdb/index.jsp, accessed on 28 August 2022). Statistically significant signatures were selected (with a false detection rate (FDR) of <0.05) and placed in order of the normalized enrichment score (NES), which represents the strength of the relationship between the phenotype and gene signature. Black bars indicate pathways enriched in the high-SPOCK1-expression group. (B) GSEA of TCGA KIRC dataset showed an enrichment of gene signatures associated with the EMT in the high-SPOCK1-expression group. (C) The correlations between the gene expression of SPOCK1 and EMT markers are demonstrated in the correlation plot. The RNA sequencing data of TCGA KIRC patients were utilized to perform this analysis. Pearson correlation was conducted to evaluate the relation between SPOCK1 and EMT markers. The correlation coefficients and p values between EMT markers and SPOCK1 are indicated in each square. The scale bar represents the degree of correlation values. (D,E) Caki-1 or 786-O cells were infected with a lentivirus carrying either SPOCK1 shRNAs (D), a SPOCK1-expressing vector (E), or the respective control vector and subjected to a Western blot analysis to determine expressions of EMT-related regulators (E-cadherin, N-cadherin, vimentin, Snail, and Slug). Quantitative results of the indicated proteins were adjusted to GAPDH or β-actin protein levels. (F,G) A Snail-expressing plasmid (pLEX-Snail) or Slug-expressing plasmid (pCIneo-Slug) was transfected into Caki-1 cells expressing shCtrl or shSPOCK1 as indicated and subjected to a Western blot analysis (F) and Matrigel invasion assay (G). Quantitative results of Snail and Slug were adjusted to the GAPDH protein level. Values are presented as the mean ± SD of three independent experiments. *** p < 0.001, compared to the control group. ## p < 0.01 and ### p < 0.001 compared to the SPOCK1-KD-only group.
Figure 4
Figure 4
SPOCK1 regulates motility via inducing matrix metalloproteinase (MMP)-14/MMP-16-mediated MMP-2 activation in clear cell renal cell carcinoma (ccRCC) cells. (A) SPOCK1 protein–protein interaction network of 10 differentially expressed genes from the STRING database. (B) Caki-1 and 786-O cells were infected with a lentivirus carrying either SPOCK1 shRNA or shCtrl and subjected to a Western blot analysis to determine expressions of MMP-16, MMP-14, MMP-9, MMP-3, and MMP-2. (C) Treatment of Caki-1 cells with or without the recombinant SPOCK1 protein (rSPOCK1, 1 ng/mL) for 24 and 48 h, and expressions of MMP-16, MMP-14, and MMP-2 were detected by Western blotting. Quantitative results of indicated MMP proteins were adjusted to GAPDH protein levels. (D) MMP-2 activity of SPOCK1-overexpressing Caki-1 and 786-O cells was detected by a gelatin zymographic assay. (E) An MMP-2-expressing plasmid was transfected into Caki-1 cells expressing shCtrl or shSPOCK1 as indicated and subjected to transwell invasion assays. Top: Representative photomicrographs. Bottom: Quantitative results of the invasion assay are shown. *** p < 0.001, compared to the control group. ## p < 0.01 compared to the SPOCK1-KD only group. (F) Correlation analysis of the KIRC database (TCGA, PanCancer Atlas) using cBioPortal revealed positive correlations of SPOCK1 or MMP2 with mRNA levels of the indicated MMP genes. (G) Combined expressions of high SPOCK1 and high MMP14, MMP16, or MMP2 were correlated with the overall survival of patients with ccRCC. The p value refers to a comparison between SPOCK1high/MMPhigh and other groups (SPOCKhigh/MMPlow, SPOCKlow/MMPhigh, or SPOCKlow/MMPlow).
Figure 5
Figure 5
SPOCK1-induced Snail family-mediated transactivation of matrix metalloproteinase (MMP)-2 in clear cell renal cell carcinoma (ccRCC) cells. (A,B) Caki-1 cells were infected with a lentivirus carrying either shSPOCK1, SPOCK1, or their respective controls and subjected to a real-time qPCR analysis to analyze mRNA expression of MMP2 (A) and an MMP-2 promoter reporter assay to analyze the promoter activity of MMP-2 (B). Quantitative results of MMP2 mRNA levels were adjusted to actin mRNA levels. Values are presented as the mean ± SD of three independent experiments. * p < 0.05, ** p < 0.01, *** p < 0.001, compared to the control group. (C,D) Snail, Slug, shSPOCK1, and their respective control vectors were overexpressed in Caki-1 cells as indicated. Expression levels of MMP2 mRNA and MMP-2 proteins were detected by real-time qPCR (C) and Western blot analyses (D), respectively. Quantitative MMP-2 levels were adjusted to GAPDH (protein) or actin (mRNA) levels. ** p < 0.01 compared to the control group. ## p < 0.01 compared to the SPOCK1-KD only group. (E) Correlation analysis of the KIRC database (TCGA, PanCancer Atlas) using cBioPortal revealed positive correlations between MMP2 and mRNA levels of SNAl1 or SNAl2 genes. (F) An MMP-2-expressing plasmid was transfected into Caki-1 cells expressing shCtrl or shSPOCK1 as indicated, and expression levels of EMT-related proteins were detected by a Western blot analysis.
Figure 6
Figure 6
SPOCK1 regulates tumorigenicity and invasive ability in vivo. (A) Luciferase-tagged Cak-1 cells with stable SPOCK1-KD or overexpression were implanted into kidneys of NOD/SCID mice. Luciferase activity was detected at indicated time points with an IVIS imaging system. Representative bioluminescent images of mice from the control, SPOCK1-overexpression, and SPOCK1-KD groups taken per week are shown. (B) Quantitative analysis of Xenogen imaging signal intensity (photons/s/cm2/sr) every week. (C) The H&E staining of orthotopically implanted tumors shows the interface between the generated murine tumor and renal parenchyma. At the end of the study, tumor-injected kidneys were isolated and examined by the H&E staining. The interface between the generated murine tumor and renal parenchyma is indicated by the black dashed line, and parenchyma infiltration was observed in tumor cells overexpressing SPOCK1. Scale bar = 50 or 100 µm. (D) SPOCK1 and vimentin protein expression levels in Caki-1 orthotopic tumors expressing SPOCK1 or shSPOCK1 were measured by IHC staining. Scale bar = 30 µm. Right panel, quantification of the SPOCK1 and vimentin IHC staining score. * p < 0.05, ** p < 0.01, *** p < 0.001, compared to the control group.
Figure 7
Figure 7
A working model shows the molecular mechanism underlying the ability of SPOCK1 to promote the progression of clear cell renal cell carcinoma (ccRCC) cells. The prometastatic effect of SPOCK1 on ccRCC cells was attributed to induce the upregulation of Snail family members (Snail and Slug) following transcriptional downregulation of E-cadherin and upregulation of the matrix metalloproteinase (MMP)-2. Moreover, SPOCK1-induced upregulation of Snail family members also shows the positive feedback regulation of SPOCK1. These signal pathways ultimately trigger epithelial-to-mesenchymal transition (EMT) progression and subsequent promotion of ccRCC metastasis. Green ovals indicate hypothetical regulators which might be involved in the SPOCK1-mediated interplay of Akt and Snail family members.

References

    1. Siegel R.L., Miller K.D., Jemal A. Cancer statistics, 2016. CA Cancer J. Clin. 2016;66:7–30. doi: 10.3322/caac.21332. - DOI - PubMed
    1. Clark P.E. The role of VHL in clear-cell renal cell carcinoma and its relation to targeted therapy. Kidney Int. 2009;76:939–945. doi: 10.1038/ki.2009.296. - DOI - PMC - PubMed
    1. Casuscelli J., Becerra M.F., Manley B.J., Zabor E.C., Reznik E., Redzematovic A., Arcila M.E., Tennenbaum D.M., Ghanaat M., Kashan M., et al. Characterization and Impact of TERT Promoter Region Mutations on Clinical Outcome in Renal Cell Carcinoma. Eur. Urol. Focus. 2019;5:642–649. doi: 10.1016/j.euf.2017.09.008. - DOI - PMC - PubMed
    1. Courtney K.D., Choueiri T.K. Updates on novel therapies for metastatic renal cell carcinoma. Ther. Adv. Med. Oncol. 2010;2:209–219. doi: 10.1177/1758834010361470. - DOI - PMC - PubMed
    1. Zhong Y., Lu Y.T., Sun Y., Shi Z.H., Li N.G., Tang Y.P., Duan J.A. Recent opportunities in matrix metalloproteinase inhibitor drug design for cancer. Expert Opin. Drug Discov. 2018;13:75–87. doi: 10.1080/17460441.2018.1398732. - DOI - PubMed

Publication types