

HGCA2.0: An RNA-Seq Based Webtool for Gene Coexpression Analysis in Homo sapiens
- PMID: 36766730
- PMCID: PMC9913097
- DOI: 10.3390/cells12030388
HGCA2.0: An RNA-Seq Based Webtool for Gene Coexpression Analysis in Homo sapiens
Abstract
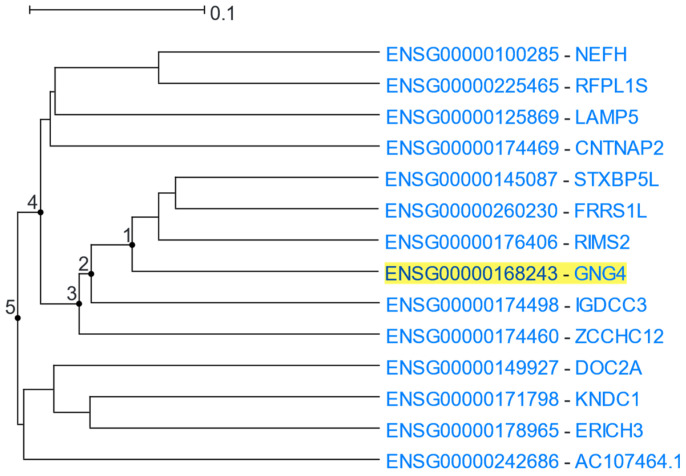
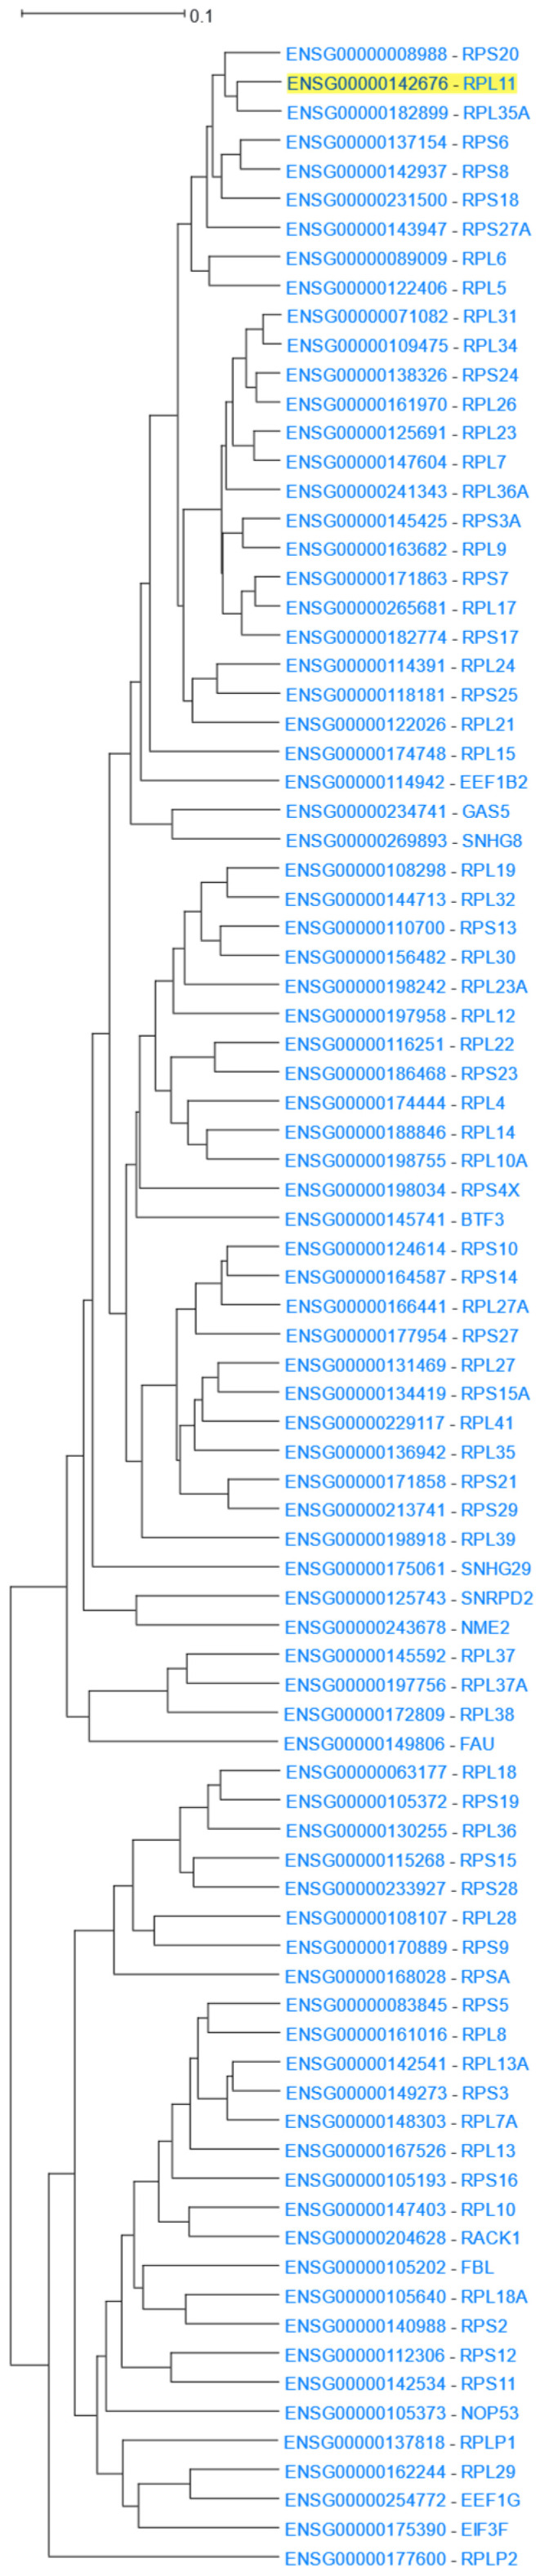
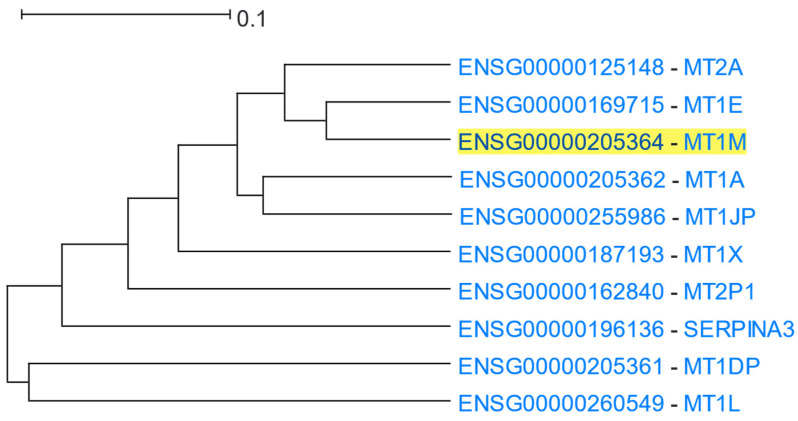
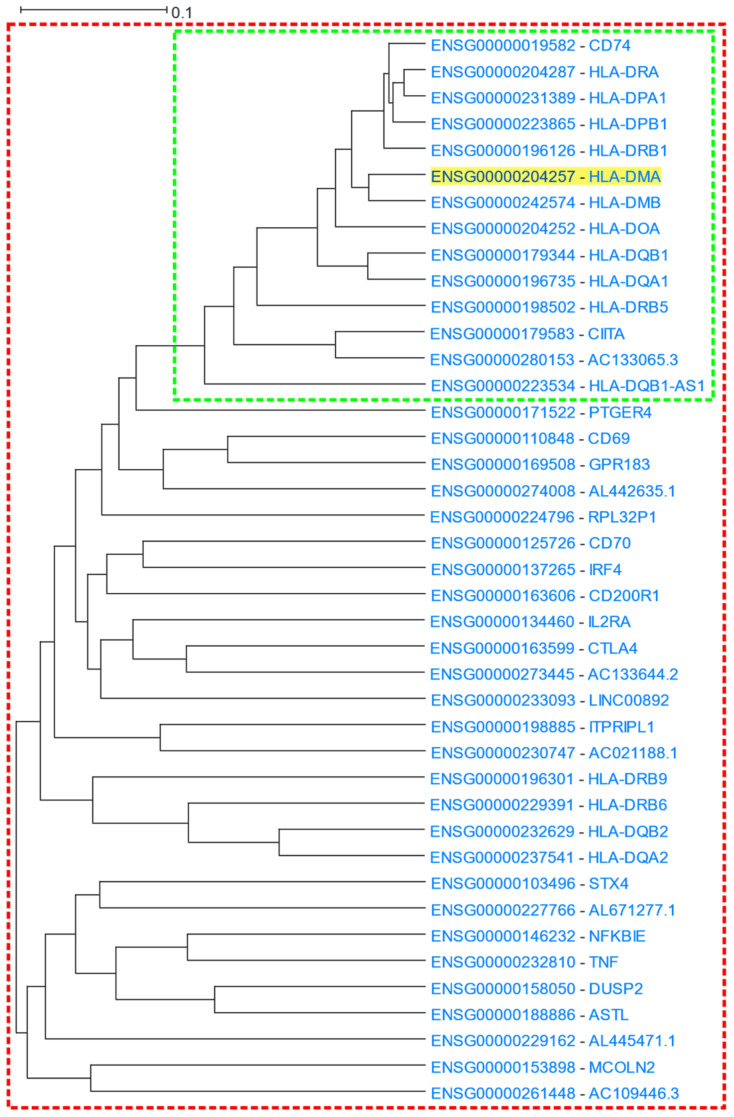
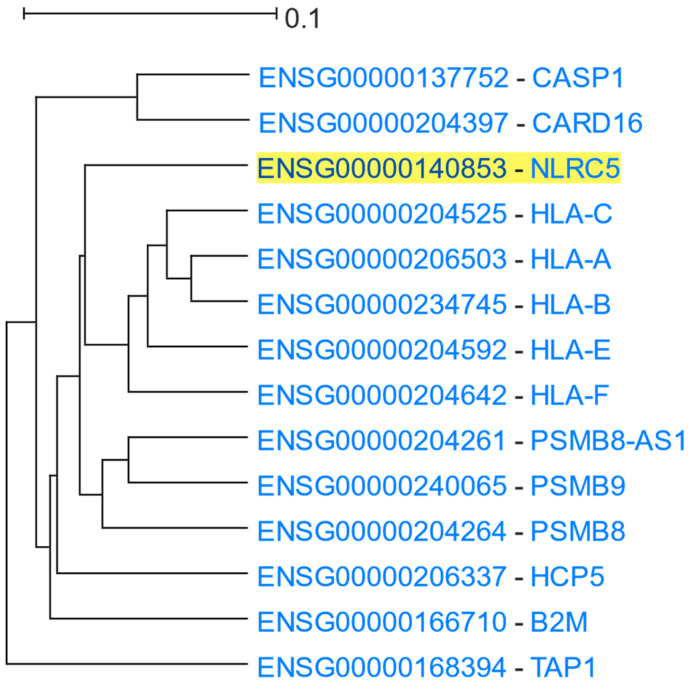
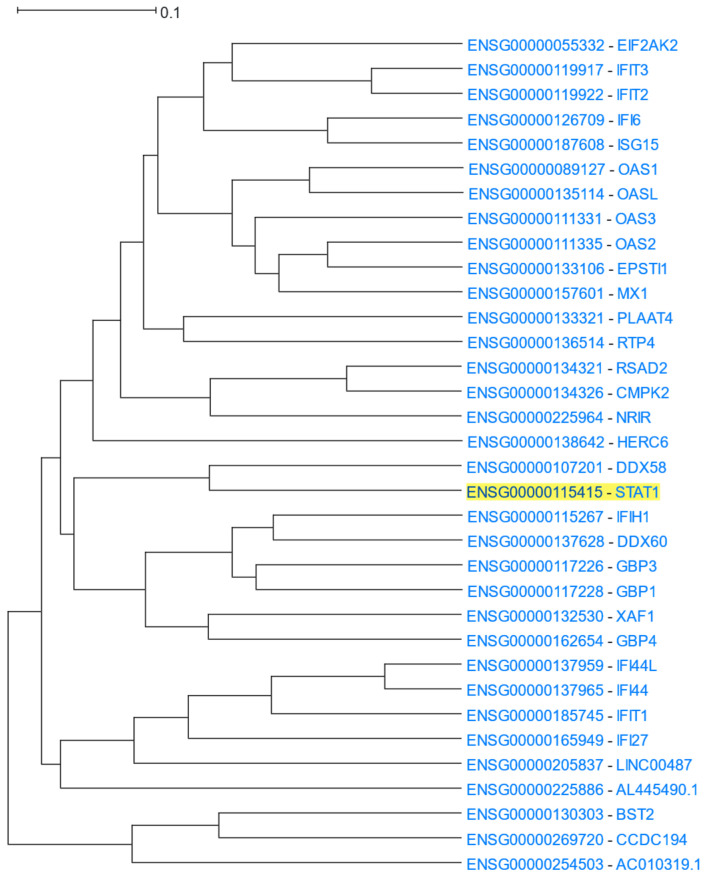
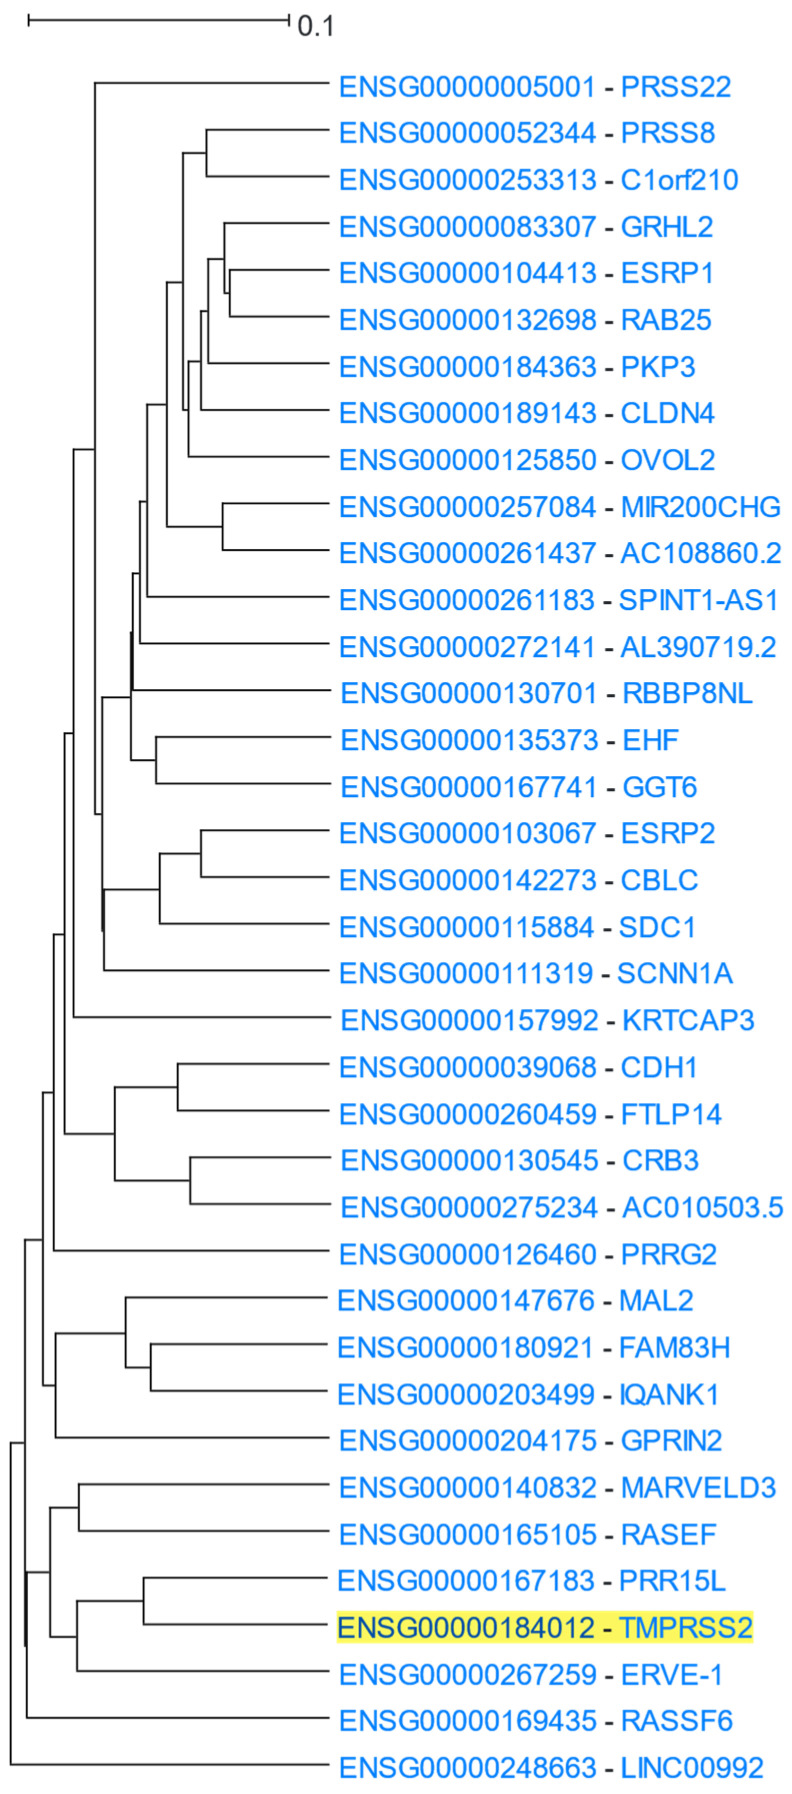
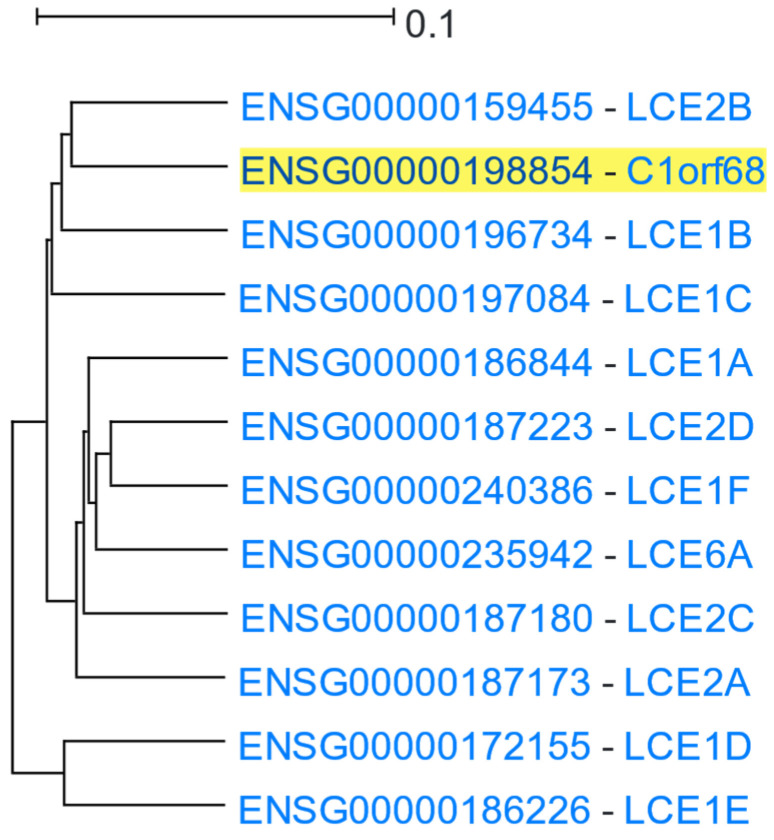
Genes with similar expression patterns in a set of diverse samples may be considered coexpressed. Human Gene Coexpression Analysis 2.0 (HGCA2.0) is a webtool which studies the global coexpression landscape of human genes. The website is based on the hierarchical clustering of 55,431 Homo sapiens genes based on a large-scale coexpression analysis of 3500 GTEx bulk RNA-Seq samples of healthy individuals, which were selected as the best representative samples of each tissue type. HGCA2.0 presents subclades of coexpressed genes to a gene of interest, and performs various built-in gene term enrichment analyses on the coexpressed genes, including gene ontologies, biological pathways, protein families, and diseases, while also being unique in revealing enriched transcription factors driving coexpression. HGCA2.0 has been successful in identifying not only genes with ubiquitous expression patterns, but also tissue-specific genes. Benchmarking showed that HGCA2.0 belongs to the top performing coexpression webtools, as shown by STRING analysis. HGCA2.0 creates working hypotheses for the discovery of gene partners or common biological processes that can be experimentally validated. It offers a simple and intuitive website design and user interface, as well as an API endpoint.
Keywords: RNA-Seq; bioinformatics; co-expression; gene coexpression analysis; gene coexpression network; transcriptomics; webtool.
Conflict of interest statement
The authors declare no conflict of interest.
Figures
Similar articles
-
Arabidopsis Coexpression Tool: a tool for gene coexpression analysis in Arabidopsis thaliana.iScience. 2021 Jul 10;24(8):102848. doi: 10.1016/j.isci.2021.102848. eCollection 2021 Aug 20. iScience. 2021. PMID: 34381973 Free PMC article.
-
Approaches in Gene Coexpression Analysis in Eukaryotes.Biology (Basel). 2022 Jul 6;11(7):1019. doi: 10.3390/biology11071019. Biology (Basel). 2022. PMID: 36101400 Free PMC article. Review.
-
Robust normalization and transformation techniques for constructing gene coexpression networks from RNA-seq data.Genome Biol. 2022 Jan 3;23(1):1. doi: 10.1186/s13059-021-02568-9. Genome Biol. 2022. PMID: 34980209 Free PMC article.
-
Human gene coexpression landscape: confident network derived from tissue transcriptomic profiles.PLoS One. 2008;3(12):e3911. doi: 10.1371/journal.pone.0003911. Epub 2008 Dec 15. PLoS One. 2008. PMID: 19081792 Free PMC article.
-
Network analysis of psoriasis reveals biological pathways and roles for coding and long non-coding RNAs.BMC Genomics. 2016 Oct 28;17(1):841. doi: 10.1186/s12864-016-3188-y. BMC Genomics. 2016. PMID: 27793094 Free PMC article.
Cited by
-
CoGTEx: Unscaled system-level coexpression estimation from GTEx data forecast novel functional gene partners.PLoS One. 2024 Oct 4;19(10):e0309961. doi: 10.1371/journal.pone.0309961. eCollection 2024. PLoS One. 2024. PMID: 39365797 Free PMC article.
-
A network-based approach reveals long non-coding RNAs associated with disease activity in lupus nephritis: key pathways for flare and potential biomarkers to be used as liquid biopsies.Front Immunol. 2023 Jul 5;14:1203848. doi: 10.3389/fimmu.2023.1203848. eCollection 2023. Front Immunol. 2023. PMID: 37475860 Free PMC article.
-
GeneCOCOA: Detecting context-specific functions of individual genes using co-expression data.PLoS Comput Biol. 2025 Mar 31;21(3):e1012278. doi: 10.1371/journal.pcbi.1012278. eCollection 2025. PLoS Comput Biol. 2025. PMID: 40163580 Free PMC article.
References
-
- Usadel B., Obayashi T., Mutwil M., Giorgi F.M., Bassel G.W., Tanimoto M., Chow A., Steinhauser D., Persson S., Provart N.J. Co-expression tools for plant biology: Opportunities for hypothesis generation and caveats. Plant Cell Environ. 2009;32:1633–1651. doi: 10.1111/j.1365-3040.2009.02040.x. - DOI - PubMed
Publication types
MeSH terms
Substances
LinkOut - more resources
Full Text Sources
Medical
Molecular Biology Databases
