. 2023 Jan 30;12(3):450.
doi: 10.3390/cells12030450.

T Cell Energy Metabolism Is a Target of Glucocorticoids in Mice, Healthy Humans, and MS Patients

Affiliations

T Cell Energy Metabolism Is a Target of Glucocorticoids in Mice, Healthy Humans, and MS Patients

Leonie Meyer-Heemsoth et al. Cells. .

Abstract

Glucocorticoids (GCs) are used to treat inflammatory disorders such as multiple sclerosis (MS) by exerting prominent activities in T cells including apoptosis induction and suppression of cytokine production. However, little is known about their impact on energy metabolism, although it is widely accepted that this process is a critical rheostat of T cell activity. We thus tested the hypothesis that GCs control genes and processes involved in nutrient transport and glycolysis. Our experiments revealed that escalating doses of dexamethasone (Dex) repressed energy metabolism in murine and human primary T cells. This effect was mediated by the GC receptor and unrelated to both apoptosis induction and Stat1 activity. In contrast, treatment of human T cells with rapamycin abolished the repression of metabolic gene expression by Dex, unveiling mTOR as a critical target of GC action. A similar phenomenon was observed in MS patients after intravenous methylprednisolon (IVMP) pulse therapy. The expression of metabolic genes was reduced in the peripheral blood T cells of most patients 24 h after GC treatment, an effect that correlated with disease activity. Collectively, our results establish the regulation of T cell energy metabolism by GCs as a new immunomodulatory principle.

Keywords: T cells; glucocorticoids; metabolism; multiple sclerosis.


Conflict of interest statement

The authors declare no conflict of interest.

Figures

Figure 1
Figure 1
Repression of metabolic genes in murine T cells by Dex treatment in vitro. (A) Setup of the experimental model. (B) T cells were purified from spleen and lymph nodes of C57BL/6 wild-type mice and stimulated with mCD3ε and mCD28 antibodies for 24 h, either in the absence (act) or presence of 10−9 to 10−6 M Dex. Gene expression was determined by RT-qPCR. N = 7–30. (C) T cells were purified from GRflox or GRlck mice and treated as described for panel B. Gene expression was determined by RT-qPCR. N = 10–15. Relative mRNA levels were calculated by normalization to the housekeeping gene Hprt. Expression in activated T cells was arbitrarily set to 1. Values are depicted as the mean ± SEM. Statistical analysis was performed by one-way ANOVA followed by a multiple comparisons test. Levels of significance: * p < 0.05; ** p < 0.01; *** p < 0.001; n.s.: p > 0.05.
Figure 2
Figure 2
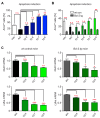
Role of apoptosis induction for the metabolic control of murine T cells by Dex in vitro. (A) T cells were purified from spleen and lymph nodes of C57BL/6 wild-type mice and stimulated with mCD3ε and mCD28 antibodies for 24 h in the absence (act) or presence of 10−9 to 10−6 M Dex. T cells without stimulation served as a control (con). Apoptosis induction was determined by flow cytometric analysis of AnxV+ cells amongst CD3+ CD4+ T cells. N = 4. (B) T cells were purified from wild-type (wt), control (con), or Bcl-2 tg mice. Treatment and analysis were performed as in panel A. N = 3. (C) T cells were obtained from wt, control, or Bcl-2 tg mice and treated as in panels A/B. Gene expression was determined by RT-qPCR. N = 5. Relative mRNA levels were calculated by normalization to the housekeeping gene Hprt. Expression in activated T cells was arbitrarily set to 1. Values are depicted as the mean ± SEM. Statistical analysis was performed by one-way ANOVA followed by a multiple comparisons test. Levels of significance: * p < 0.05; ** p < 0.01; *** p < 0.001; n.s.: p > 0.05.
Figure 3
Figure 3
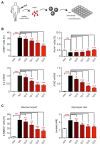
Repression of T cell functions and metabolic processes in human peripheral blood T cells by Dex in vitro. (A) Setup of the experimental model. (B) T cells were purified from buffy coats of healthy human donors and stimulated with hCD3ε and hCD28 antibodies for 20 h in the absence (act) or presence of 10−8 to 10−5 M Dex. Unstimulated T cells served as a control (con). The percentages of CD69+ and AnxV+ CD3+ CD4+ T cells were determined by flow cytometric analysis; N = 17/12. IL2 and IFNG gene expression was analyzed by RT-qPCR. N = 12. Relative mRNA levels were calculated by normalization to the housekeeping gene 18SRNA. Expression in activated T cells was arbitrarily set to 1. (C) T cells were purified and treated as described for panel B. Glucose import was determined by incubating the cells for 1 hr with fluorescently labeled 2-NBDG and measuring the percentage of CD3+ CD4+ T cells positively stained for 2-NBDG by flow cytometry (left panel, N = 15). The glycolysis rate was analyzed by measuring the absolute concentration of lactate in the cell culture supernatant with the help of a photometric assay (right panel, N = 4). All values are depicted as the mean ± SEM. Statistical analysis was performed by one-way ANOVA followed by a multiple comparisons test. Levels of significance: * p < 0.05; ** p < 0.01; *** p < 0.001; n.s.: p > 0.05.
Figure 4
Figure 4
Repression of metabolic genes in human peripheral blood T cells by Dex treatment in vitro. T cells were purified from buffy coats of healthy human donors and stimulated with hCD3ε and hCD28 antibodies for 20 h in the absence (act) or presence of 10−8 to 10−5 M Dex. Unstimulated T cells served as a control (con). Gene expression was determined by RT-qPCR. N = 9–12. Relative mRNA levels were calculated by normalization to the housekeeping gene 18SRNA. Expression in activated T cells was arbitrarily set to 1. Values are depicted as the mean ± SEM. Statistical analysis was performed by one-way ANOVA followed by a multiple comparisons test. Levels of significance: * p < 0.05; ** p < 0.01; *** p < 0.001; n.s.: p > 0.05.
Figure 5
Figure 5
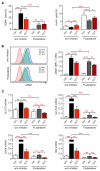
Role of Stat1 signaling for the repressive activity of Dex on T cell function and metabolic gene expression in human peripheral blood T cells. (A) T cells were purified from buffy coats of healthy human donors and stimulated with hCD3ε and hCD28 antibodies for 20 h in the absence (act) or presence of 10−5 M Dex. Unstimulated T cells served as a control (con). To study the role of Stat1, fludarabine was added at a concentration of 50 µg/mL to the same experimental setup. The percentages of CD69+ and AnxV+ CD3+ CD4+ T cells were determined by flow cytometric analysis. N = 10/12. (B) T cells were treated as in panel A. After extracellular staining for CD3, CD4, and CD69, the cells were fixed, permeabilized, and then intracellularly stained for pStat1 (Tyr701). Analysis was performed by flow cytometry. Exemplary overlay histograms of pStat1 stainings of CD4+ T cells (con) or CD4+ CD69+ T cells (act, 10−5 M Dex) are depicted in the left panel. The mean fluorescence intensity (MFI) of pStat1 for CD4+ T cells (con) or CD4+ CD69+ T cells (act, 10−5 M Dex) is depicted in the right panel. N = 6. (C) Expression of metabolic genes was determined by RT-qPCR. N = 7. Relative mRNA levels were calculated by normalization to the housekeeping gene 18SRNA. Expression in activated T cells was arbitrarily set to 1. Values are depicted as the mean ± SEM. Statistical analysis was performed by one-way ANOVA followed by a multiple comparisons test. Levels of significance: * p < 0.05; ** p < 0.01; *** p < 0.001; n.s.: p > 0.05.
Figure 6
Figure 6
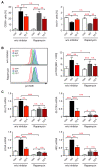
Role of mTOR signaling for the repressive activity of Dex on T cell function and metabolic gene expression in human peripheral blood T cells. (A) T cells were purified from buffy coats of healthy human donors and stimulated with hCD3ε and hCD28 antibodies for 20 h in the absence (act) or presence of 10−5 M Dex. Unstimulated T cells served as a control (con). To study the role of mTOR, rapamycin was added at a concentration of 20 nM to the same experimental setup. The percentages of CD69+ and AnxV+ CD3+ CD4+ T cells were determined by flow cytometric analysis. N = 9/3. (B) T cells were treated as in panel A. After extracellular staining for CD3, CD4, and CD69, the cells were fixed, permeabilized, and intracellularly stained for pmTOR (Ser2448). Analysis was performed by flow cytometry. Exemplary overlay histograms of pmTOR stainings of CD4+ T cells (con) or CD4+ CD69+ T cells (act, 10−5 M Dex) are depicted in the left panel. The mean fluorescence intensity (MFI) of pmTOR for CD4+ T cells (con) or CD4+ CD69+ T cells (act, 10−5 M Dex) is depicted in the right panel. N = 6. (C) Gene expression was determined by RT-qPCR. N = 7. Relative mRNA levels were calculated by normalization to the housekeeping gene 18SRNA. Expression in activated T cells was arbitrarily set to 1. Values are depicted as the mean ± SEM. Statistical analysis was performed by one-way ANOVA followed by a multiple comparisons test. Levels of significance: * p < 0.05; ** p < 0.01; *** p < 0.001; n.s., non-significant (p > 0.05).
Figure 7
Figure 7
Comparison of metabolic gene expression in human peripheral blood T cells obtained from MS patients before and after IVMP therapy. (A) Setup of the experimental model. (B) T cells were purified from blood collected from PPMS and SPMS patients immediately before IVMP therapy and 24 h later; stained with CD3, CD4, and CD8 antibodies; and analyzed by flow cytometry. Absolute numbers of CD3+ T cells per ml of blood (upper panel) and the ratio between CD4+ and CD8+ T cells (lower panel) are depicted as the mean ± SEM. N = 18/17. (C) T cells were purified from blood samples as described for panel B. Gene expression was determined by RT-qPCR, and relative mRNA levels were calculated by normalization to the housekeeping gene 18SRNA. N = 12–19. The average expression in T cells isolated before IVMP administration was arbitrarily set to 1 for each gene. Each dot corresponds to one patient. Statistical analysis in panels B/C was performed by one-way ANOVA followed by a multiple comparisons test. Levels of significance: * p < 0.05; ** p < 0.01; *** p < 0.001. (D) Presentation of the RT-qPCR results from panel C individually for each patient. N = 13–16. Gene expression in T cells isolated before IVMP infusion was arbitrarily set to 1 for each individual patient, and the relative gene expression after therapy was calculated in relation to it.
Figure 8
Figure 8
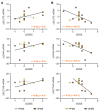
Correlation between changes in metabolic gene expression in human peripheral blood T cells from PPMS and SPMS patients during IVMP therapy and clinical parameters. (A) For each patient the ∆EDSS score was determined as the difference between the EDSS at the time of blood collection and the EDSS at initial diagnosis with a negative ∆EDSS indicating clinical improvement. The ∆gene mRNA value reflects the fold difference between gene expression before and after IVMP with a negative value indicating a decrease in gene expression after therapy. The graphs depict the correlation between both parameters separately for PPMS and SPMS patients with each dot representing one individual patient. The solid line represents the linear regression curve for SPMS, the dotted line for PPMS patients. N = 4–5 (PPMS), N = 8–10 (SPMS). (B) The graphs depict the correlation between the EDSS score at the time of blood collection and the ∆gene mRNA value separately for PPMS and SPMS patients with each dot representing one individual patient. The solid line represents the linear regression curve for SPMS, the dotted line for PPMS patients. N = 4–5 (PPMS), N = 9–11 (SPMS). The Spearman correlation coefficient (r) and the level of significance (* p < 0.05) are indicated in each graph solely for the analysis of SPMS patients.

References

    1. Reichardt S.D., Amouret A., Muzzi C., Vettorazzi S., Tuckermann J.P., Lühder F., Reichardt H.M. The Role of Glucocorticoids in Inflammatory Diseases. Cells. 2021;10:2921. doi: 10.3390/cells10112921. - DOI - PMC - PubMed
    1. Wüst S., van den Brandt J., Tischner D., Kleiman A., Tuckermann J.P., Gold R., Lühder F., Reichardt H.M. Peripheral T cells are the therapeutic targets of glucocorticoids in experimental autoimmune encephalomyelitis. J. Immunol. 2008;180:8434–8443. - PubMed
    1. Theiss-Suennemann J., Jorss K., Messmann J.J., Reichardt S.D., Montes-Cobos E., Lühder F., Tuckermann J.P., Wolff H.A., Dressel R., Gröne H.J., et al. Glucocorticoids attenuate acute graft-versus-host disease by suppressing the cytotoxic capacity of CD8(+) T cells. J. Pathol. 2015;235:646–655. doi: 10.1002/path.4475. - DOI - PubMed
    1. Baschant U., Frappart L., Rauchhaus U., Bruns L., Reichardt H.M., Kamradt T., Brauer R., Tuckermann J.P. Glucocorticoid therapy of antigen-induced arthritis depends on the dimerized glucocorticoid receptor in T cells. Proc. Natl. Acad. Sci. USA. 2011;108:19317–19322. doi: 10.1073/pnas.1105857108. - DOI - PMC - PubMed
    1. Wang D., Müller N., McPherson K.G., Reichardt H.M. Glucocorticoids engage different signal transduction pathways to induce apoptosis in thymocytes and mature T cells. J. Immunol. 2006;176:1695–1702. doi: 10.4049/jimmunol.176.3.1695. - DOI - PubMed

Publication types