. 2023 Feb 1;12(3):472.
doi: 10.3390/cells12030472.

Promotion of Lymphangiogenesis by Targeted Delivery of VEGF-C Improves Diabetic Wound Healing

Affiliations

Promotion of Lymphangiogenesis by Targeted Delivery of VEGF-C Improves Diabetic Wound Healing

Lorenz M Brunner et al. Cells. .

Abstract

Chronic wounds represent a major therapeutic challenge. Lymphatic vessel function is impaired in chronic ulcers but the role of lymphangiogenesis in wound healing has remained unclear. We found that lymphatic vessels are largely absent from chronic human wounds as evaluated in patient biopsies. Excisional wound healing studies were conducted using transgenic mice with or without an increased number of cutaneous lymphatic vessels, as well as antibody-mediated inhibition of lymphangiogenesis. We found that a lack of lymphatic vessels mediated a proinflammatory wound microenvironment and delayed wound closure, and that the VEGF-C/VEGFR3 signaling axis is required for wound lymphangiogenesis. Treatment of diabetic mice (db/db mice) with the F8-VEGF-C fusion protein that targets the alternatively spliced extra domain A (EDA) of fibronectin, expressed in remodeling tissue, promoted wound healing, and potently induced wound lymphangiogenesis. The treatment also reduced tissue inflammation and exerted beneficial effects on the wound microenvironment, including myofibroblast density and collagen deposition. These findings indicate that activating the lymphatic vasculature might represent a new therapeutic strategy for treating chronic non-healing wounds.

Keywords: VEGF-C; diabetes mellitus; inflammation; lymphangiogenesis; wound healing.


Conflict of interest statement

The authors declare no conflict of interest. The funders had no role in the design of the study; in the collection, analyses, or interpretation of data; in the writing of the manuscript; or in the decision to publish the results.

Figures

Figure 1
Figure 1
Lymphatic vessels are largely absent in human chronic ulcers. (A) Representative H&E and LYVE1 and CD31 stained sections of human healthy skin, wound edge, and ulcer of a chronic wound. Healthy skin is characterized by a continuous basal membrane. The adjacent wound edge is re-epithelialized. The ulcer is defined through its non-epithelialized characteristics. Scale bars: 500 µm. White arrowheads depict LVs. (B) Quantification of the number of LVs per mm2 in representative regions of wound edges adjacent to ulcerative regions and ulcers. N = 6–7. Students t-test, p < 0.05 (*).
Figure 2
Figure 2
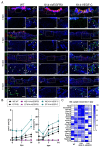
Wound lymphangiogenesis is mediated by the VEGF-C/VEGFR3 signaling axis. (A) Representative LYVE1 and CD31 stained sections of unwounded skin, and wounds at 3-, 7-, 10-, and 14-days post-wounding (dpw) of WT, K14-VEGFR3-Fc, and K14-VEGF-C mice. Scale bars: Overview 500 µm, GT, WE: 100 µm. White arrowheads depict LVs. (B) LYVE1+ area [%] and the number of LVs divided by the length of BM [mm−1] of WT, K14-VEGFR3-Fc, and K14-VEGF-C mice at 3-, 7-, 10-, and 14-days dpw. N = 3–5 mice per group, 2–3 wounds each. (C) Relative gene expression of genes in GO: Lymph vessel development. Gene expression is displayed as a percentage of the expression level of the sample with the highest value for each gene. N = 2 wounds per group. Scale: 0–100%. GT: Granulation tissue, WE: Wound edge, dpw: days post-wounding.
Figure 3
Figure 3
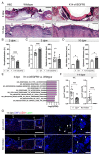
Lack of lymphangiogenesis delays wound closure and blocking of VEGFR3 completely inhibits lymphangiogenesis. (A) H&E representative sections of WT and K14-VEGFR3-Fc transgenic mice at 3- and 10-dpw. Scale bar: 500 µm. 8–11 wounds of 5 mice. (B) Re-epithelialization [%] of WT and K14-VEGFR3-Fc transgenic mice at 3 dpw. (C) Hair follicle distance [mm] and epidermis thickness [µm] of WT and K14-VEGFR3-Fc transgenic mice at 3 dpw. Scale bars: 500 µm. N = 13–16 wounds of 5 mice. (D) Hair follicle distance [mm] and epidermis thickness [µm] of WT and K14-VEGFR3-Fc transgenic mice 10 dpw. N = 2–5 mice with 2–3 wounds each. (E) Top 10 enriched GO terms in K14-VEGFR3-Fc transgenic versus WT mice at 3 dpw. (F) LYVE1+ area [%] and the number of LVs [mm−1] 14 dpw. N = 14 wounds of 6 mice. (G) Representative images of LYVE1-CD31 stained wound sections 14 dpw. Scale bars: Overview 500 µm, GT, WE: 200 µm. White arrowheads depict LVs. GT: Granulation tissue, WE: Wound edge, dpw: days post-wounding, BM: Basal membrane, E: Epidermis, HF: Hair follicle. Students t-test, p < 0.05 (*), p < 0.001 (***), p < 0.0001 (****).
Figure 4
Figure 4
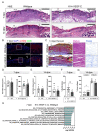
Increased lymphatic vessel area reduces myofibroblast density and delays collagen maturation. (A) H&E representative sections of WT and K14-VEGFR3-Fc transgenic mice at 3- and 10 dpw. Scale bar: 500 µm. (B) Representative α-SMA and CD31 stained sections of WT and K14-VEGF-C mice 7 dpw. Scale bars: Overview: 500 µm, Zoom-in: 100 µm. (C) Herovici’s stain representative sections of WT and K14-VEGF-C mice 14 dpw. Single-channel images of Herovici staining for the colors of mature (purple) and young (light blue) collagen are shown. Scale bars: Overview: 500 µm, mature, young: 100 µm. (D) Hair follicle distance [mm] and epidermis thickness [µm] of WT and K14-VEGF-C mice at 7 dpw. N = 12–13 wounds of 5 mice. Scale bars: 500 µm. (E) Hair follicle distance [mm] and epidermis thickness [µm] of WT and K14-VEGF-C mice at 14 dpw. N = 11–13 wounds of 5 mice. (F) Myofibroblast+ area [%] (CD31+ area deducted from α-SMA+ area) of WT and K14-VEGF-C mice 7 dpw. N = 9–13 wounds of 5 mice. (G) Young (light blue) and mature (purple) collagen area normalized to BM of WT and K14-VEGF-C mice 14 dpw. 8–9 wounds of 3 mice. (H) Top 10 enriched GO terms in K14-VEGF-C versus WT mice at 7 dpw. N = 2 wounds per group. GT: Granulation tissue, WE: Wound edge, dpw: days post-wounding, BM: Basal membrane, E: Epidermis, HF: Hair follicle. Students t-test, p < 0.05 (*), p < 0.01 (**).
Figure 5
Figure 5
The F8–VEGF-C fusion protein is specific for regenerating tissue and improves wound morphometry. (A) Full-thickness excisional wound healing model in db/db mice. Blood glucose measurement prior to wounding on day 0 (inclusion criteria: blood glucose ≥250 mg/dL). Injection of F8-SIP or F8–VEGF-C every other day from day 1. (B) Schematic illustration of the fusion protein F8–VEGF-C. (C) Representative EDA-FN and CD31 staining image at the wound edge at 5 dpw. Scale bar: Overview 200 µm, Zoom-ins: 40 µm. (D) Representative images of wounds of F8-SIP or F8–VEGF-C treated mice at 0, 1, 2, 5 and 7 dpw. Scale bars: 5 mm. (E) Wound closure [%] of F8-SIP vs. F8–VEGF-C-treated mice. Wound closure was significantly increased at 3 dpw. N = 15 mice, from 3 independent experiments. (F) Representative images of H&E-stained sections of wounds treated with F8-SIP or F8–VEGF-C at 7 dpw. (G) Dynamic wound analysis of H&E-stained sections 7 dpw. Slightly increased re-epithelialization [%] and average wound width [mm], and slightly reduced epidermis thickness [µm] in F8–VEGF-C-treated mice. N = 16–18 wounds of 6 mice per group. (H) The number of proliferating keratinocytes per µm BM was significantly increased in F8-SIP-treated wounds at 7 dpw. N = 1–3 wound of 5 mice for F8–VEGF-C, N = 2–3 wounds of 3 mice for F8-SIP. BM: basal membrane, dashed lines: basal membrane, WE: Wound edge, dpw: days post-wounding. Students t-test, p < 0.05 (*), p < 0.01 (**).
Figure 6
Figure 6
Targeted delivery of VEGF-C potently induces lymphangiogenesis in diabetic wounds. (A) Representative images of LYVE1 and CD31 stained sections of F8-SIP and F8–VEGF-C-treated db/db mice at 7 dpw. Magnifications of GT and WE are shown in LYVE1 and CD31, respectively. More LVs are present in the GT area of the F8–VEGF-C treated mice. The CD31+ area was comparable in the GT and the WEs in both groups. White arrowheads depict LVs. The white box indicates areas for magnified images. Scale bars: Overview 500 µm, GT, WE: 200 µm. (B) LYVE1+ area [%] and the number of LVs [mm−1] at 7 dpw quantified next to the WE and in the GT. Quantification revealed a significant increase of LV area in the GT. The number of LVs per mm BM was significantly increased in the GT of F8–VEGF-C-treated wounds. N = 6 mice per group. (C) The LV size was comparable in the two treatment groups in the GT and in the WEs. N = 6 mice per group. (D) There was no difference in the blood vessel area between the two treatment groups for the GT area and the WEs at 7 dpw. N = 6 mice per group. (E) LYVE1+ area [%] and the number of LVs [mm−1] at 10 dpw quantified next to the WE and in the GT. A significant increase in the LV area and number was observed in the GT at dpw. N = 8 mice per group. (F) Top 10 enriched GO terms in F8–VEGF-C-treated versus F8-SIP-treated db/db mice at 7 dpw. N = 3 wounds per group. (G) Relative gene expression of genes in GO: Lymph vessel development. Gene expression is displayed as a percentage of the expression level of the sample with the highest value for each gene. N = 3 wounds per group. Scale: 0–100%. GT: Granulation tissue, WE: Wound edge, dpw: days post-wounding, BM: Basal membrane, E: Epidermis, HF: Hair follicle. Students t-test, p < 0.05 (*), p < 0.01 (**), p < 0.0001 (****).
Figure 7
Figure 7
Targeted delivery of VEGF-C reduces immune cell density in diabetic wounds. (A) Representative images of CD45 and CD68 stained sections of F8-SIP- and F8–VEGF-C-treated db/db mice at 7 dpw. Scale bars: 200 µm. (B) CD45+ area [%] quantified in the GT at 7 dpw. The CD45 area was significantly decreased in the wounds of F8–VEGF-C-treated mice. (C) CD68+ area [%] quantified in the GT at 7 dpw. The CD68 area was comparable between the two treatment groups. (D) Relative gene expression of selected inflammatory genes from GSEA. Gene expression is displayed as a percentage of the expression level of the sample with the highest value for each gene. N = 9–11 wounds of 5–6 mice per group. Scale: 0–100%. Students t-test, p < 0.05 (*).
Figure 8
Figure 8
Targeted delivery of VEGF-C increases myofibroblast density and collagen I deposition in diabetic wounds. (A) Representative α-SMA and desmin stained sections of F8-SIP- and F8–VEGF-C-treated db/db mice at 7 dpw. Enlarged images showing more abundant myofibroblasts in the center of the F8–VEGF-C-treated wounds compared to the F8-SIP-treated wounds. Scale bars: Overview: 500 µm, Zoom-in: 200 µm. (B) Myofibroblast+ area [%] (desmin+ area deducted from α-SMA+ area) of F8-SIP- and F8–VEGF-C-treated db/db mice at 7 dpw. The density of myofibroblasts in the GT of the F8–VEGF-C group was significantly higher compared to the F8-SIP-treated wounds at 7 dpw. The myofibroblast density was comparable at 10 dpw. (C) Relative gene expression of genes in GO: SMC migration. Gene expression is displayed as a percentage of the expression level of the sample with the highest value for each gene. N = 3 wounds per group. (D) Collagen I+ area [%] at 7 dpw quantified in the GT. The area of collagen type I was significantly increased in the F8–VEGF-C-treated wounds. (E) Collagen III+ area [%] at 7 dpw quantified in the GT. The collagen type III area was significantly decreased in the F8–VEGF-C-treated wounds. (F) Representative collagen type I and III-stained sections of F8-SIP- and F8–VEGF-C-treated wounds at 7 dpw. The enlarged images highlight that there was more collagen type III and less collagen Type I present in the F8-SIP-treated wounds at 7 dpw. (B,DF). N = 18 wounds of 6 mice for each group. WE: Wound edge, dpw: days post-wounding, BM: Basal membrane (dashed white line). Students t-test, p < 0.05 (*), p < 0.01 (**), p < 0.001 (***).

References

    1. Gurtner G.C., Werner S., Barrandon Y., Longaker M.T. Wound repair and regeneration. Nature. 2008;453:314–321. doi: 10.1038/nature07039. - DOI - PubMed
    1. Eming S.A., Martin P., Tomic-Canic M. Wound repair and regeneration: Mechanisms, signaling, and translation. Sci. Transl. Med. 2014;6:265sr6. doi: 10.1126/scitranslmed.3009337. - DOI - PMC - PubMed
    1. Falanga V. Wound healing and its impairment in the diabetic foot. Lancet. 2005;366:1736–1743. doi: 10.1016/S0140-6736(05)67700-8. - DOI - PubMed
    1. Cueni L.N., Detmar M. Lymphatic Vascular System and Lymphangiogenesis. In: Figg W.D., Folkman J., editors. Angiogenesis. Springer; Boston, MA, USA: 2008. pp. 505–516. Chapter 43.
    1. Dieterich L.C., Tacconi C., Ducoli L., Detmar M. Lymphatic vessels in cancer. Physiol. Rev. 2022;102:1837–1879. doi: 10.1152/physrev.00039.2021. - DOI - PubMed

Publication types

Substances

LinkOut - more resources