. 2023 Feb 2;12(3):487.
doi: 10.3390/cells12030487.

The Absence of FAIM Leads to a Delay in Dark Adaptation and Hampers Arrestin-1 Translocation upon Light Reception in the Retina

Affiliations

The Absence of FAIM Leads to a Delay in Dark Adaptation and Hampers Arrestin-1 Translocation upon Light Reception in the Retina

Anna Sirés et al. Cells. .

Abstract

The short and long isoforms of FAIM (FAIM-S and FAIM-L) hold important functions in the central nervous system, and their expression levels are specifically enriched in the retina. We previously described that Faim knockout (KO) mice present structural and molecular alterations in the retina compatible with a neurodegenerative phenotype. Here, we aimed to study Faim KO retinal functions and molecular mechanisms leading to its alterations. Electroretinographic recordings showed that aged Faim KO mice present functional loss of rod photoreceptor and ganglion cells. Additionally, we found a significant delay in dark adaptation from early adult ages. This functional deficit is exacerbated by luminic stress, which also caused histopathological alterations. Interestingly, Faim KO mice present abnormal Arrestin-1 redistribution upon light reception, and we show that Arrestin-1 is ubiquitinated, a process that is abrogated by either FAIM-S or FAIM-L in vitro. Our results suggest that FAIM assists Arrestin-1 light-dependent translocation by a process that likely involves ubiquitination. In the absence of FAIM, this impairment could be the cause of dark adaptation delay and increased light sensitivity. Multiple retinal diseases are linked to deficits in photoresponse termination, and hence, investigating the role of FAIM could shed light onto the underlying mechanisms of their pathophysiology.

Keywords: Arrestin-1; FAIM; dark adaptation; knockout mouse model; light damage; retina; rod photoreceptors; ubiquitin.


Conflict of interest statement

The authors declare no conflict of interest.

Figures

Figure 1
Figure 1
Photoreceptor and RGCs responses are altered in Faim knockout (KO) mice at 18 months. (A) Electroretinogram (ERG) recordings of mixed a- and b-wave responses at 1.5 log cd·s/m2 (A.i), positive scotopic threshold response (pSTR) (−4 log cd·s/m2) (A.ii), and representative oscillatory potentials (OPs) from each genotype (A.iii). (A.i,A.ii) data are plotted as the mean (solid line) and SEM deviation (shaded area) of each condition. Bold arrows indicate the stimulus flash. (B) Summary of ERG analysis of pSTR representing retinal ganglion cell (RGC) response, scotopic b-wave representing rod bipolar response, mixed a- and b-waves mainly representing rod responses and photopic b-wave and flicker (20 Hz) representing cone responses. To summarize, data were plotted together in B as violin plots. (C) Implicit times of the mixed a- and b-waves graphed as violin plots. Student’s t test was performed. (D) Summary of the amplitudes and implicit times recorded on ERG of the OPs. OP4-6 are considered to be linked to amacrine and RGC responses. Data in B and C are plotted as violin plots, in which the median is represented by a thick line. Data in D are represented as means and SD (n = 7–14 mice/group). Multiple Student’s t test and Student’s t test were performed between genotypes in B and C, and Two-way ANOVA and Sidak’s post-hoc test were performed in D. * p < 0.05, ** p < 0.01, **** p < 0.001.
Figure 2
Figure 2
Faim KO mice ERG analyses are not altered at three months of age. (A) ERG recordings at 1.5 log cd·s/m2 plotted as the mean (solid line) and SEM deviation (shaded area) of each condition. (B) a-wave amplitude and implicit time at 1.5 log cd·s/m2. (C) b-wave amplitude and implicit time at 1.5 log cd·s/m2. (D) ERG waves of pSTR responses at −4 log cd·s/m2 plotted as the mean (solid line) and SEM deviation (shaded area) of each condition. (E) pSTR amplitudes represented in violin plots. (F) Representative ERG recordings of OPs at 1.5 log cd·s/m2 plotted as representative data of each genotype. (G) OPs amplitudes and implicit times at 1.5 log cd·s/m2. In (B,C,G), data are plotted as mean and SD, and in E data, are plotted as violin plots. (n = 8–9 mice per genotype). Bold arrows indicate the stimulus flash. Two-way ANOVA and Sidak’s post-hoc tests were performed in (B,C,G), and Student’s t test was performed in (E). *** p < 0.005.
Figure 3
Figure 3
Faim KO mice present a delay in photoresponse deactivation at three months. (A) ERG recordings of scotopic and mixed responses (−2 and 1.5 log cd·s/m2, respectively) plotted as the mean (solid line) and SEM deviation (shaded area) of each condition. It can be observed how the recovery of the mixed response in the Faim KO animals is prolonged in time with respect to the WT mice. Black arrows indicate the stimulus flash. Red arrowheads indicate 200 ms timepoint. (B) Recovery amplitude of WT and Faim KO mice 200 ms after the flash was evoked. Two-way ANOVA and Sidak’s post-hoc tests were performed. ** p < 0.01, *** p < 0.005, **** p < 0.001 (n = 8–9 mice per genotype).
Figure 4
Figure 4
Faim KO mice show a great delay in dark adaptation in comparison to WT mice at 3 months, but few differences are found after LD. (A) ERG waves at 1.5 log cd·s/m2 after test flash (left, black arrow) and after 10′s probe flash (right, red arrow). Data are plotted as the mean (solid line) and SEM deviation (shaded area) of each condition. (A.i) ERG recordings from WT and Faim KO mice before light damage. (A.ii) ERG recordings from WT mice before and after LD. (A.iii) ERG recordings from Faim KO mice before and after LD. (B,C) Graph representing the delay in dark adaptation found in the mixed a-wave (B) and b-wave (C) of Faim KO mice in comparison to WT mice. Data are represented as mean and SD and as log(a/amax*100) or log(b/bmax*100) to interstimulus time, where “amax” and “bmax” are the a- and b-wave after the test flash, and “a” and “b” are the a- and b-wave after the probe flash. Statistical analysis was performed using two-way ANOVA when comparing only pre-LD data, and three-way ANOVA when comparing all data, including pre-LD and post-LD results. (D) Three-way ANOVA results of mixed a- and b-wave dark adaptation analyses. N = 6–7 mice for pre-LD analyses, and n = 4 for post-LD analyses. * p < 0.05, ** p < 0.01, *** p < 0.005, **** p < 0.001.
Figure 5
Figure 5
Delay in dark adaptation in Faim KO mice is maintained at 18 months of age. (A) ERG responses at 1.5 log cd·s/m2 after test flash and 10′s probe flash. Data are plotted as the mean (solid line) and SEM deviation (shaded area) of each condition. (B,C) Graph representing the delay in dark adaptation found in the mixed a-wave (B) and b-wave (C) of Faim KO mice in comparison to WT mice. Data are plotted as mean and SD and represented as log(a/amax*100) or log(b/bmax*100) to interstimulus time, where “amax” and “bmax” are the a- and b-wave after the test flash, and “a” and “b” are the a- and b-wave after the probe flash. Statistical analysis was performed using two-way ANOVA. n = 6–7 mice/group. * p < 0.05, *** p < 0.005.
Figure 6
Figure 6
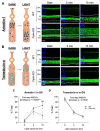
Light-dependent Arrestin-1 and Transducin-α translocation upon light reception. Diagrams representing the translocation of Arrestin-1 (A,left) and Transducin-α (B,left) from dark-adapted to light-exposed retinas. Representative images of retinal sections immunostained for Arrestin-1 (A,right) or Transducin-α (B,right) after dark-adaptation and 5 or 15 min of light stimulation. Nuclei were stained with Hoechst (blue). (C,D) Quantification of the total of Arrestin-1 and Transducin-α immunostaining in the OS relative to the total of the expression in photoreceptor segments, respectively. Arrestin-1 translocation in Faim KO mice was impaired in comparison to WT mice (C), but Transducin-α translocation remained normal (D). N = 4 mice per group. Data are represented as mean and SD and represented as total % of protein translocated in the outer segment (OS) per time of light exposure. Two-way ANOVA and Sidak’s post-hoc test was performed. *** p < 0.005. OPL: outer plexiform layer, ONL: outer nuclear layer; IS: inner segment; OS: outer segment. Scale bar: 20 μm. ** p < 0.01.
Figure 7
Figure 7
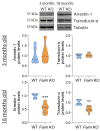
Protein levels of Arrestin-1 and Transducin-α are reduced at 18 months in Faim KO mice. Western blot analysis of Arrestin-1 and Transducin-α protein levels at 3 and 18 months of age in WT and Faim KO mice. Protein bands were quantified with ImageJ software levels and normalized to tubulin-α. Data are plotted relative to WT values and represented in violin plots. Each violin plot extends from the min to max values, the median is represented by a thick dashed line, and quartiles are represented by thin dotted lines. N = 5–9 mice per group. Statistical analysis was performed using Student’s t test. ** p < 0.01, *** p < 0.005.
Figure 8
Figure 8
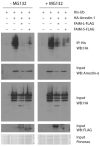
FAIM-S and FAIM-L block Arrestin-1 ubiquitination in vitro. HEK293T cells were transfected with the described plasmids, in the presence or absence of MG132 treatment, as indicated. Successful transfection was confirmed by immunoblotting for HA and FLAG for Arrestin-1 and both FAIM-L and FAIM-S expression, respectively. Ponceau staining was used to check protein loading. Ubiquitin-His pull-down were run in a gel and immunoblotted for HA. Evident ubiquitination is observed in the condition were Arrestin-1 is expressed alone with ubiquitin, and a significant decrease of ubiquitin is found in both conditions in which FAIM-L and FAIM-S are overexpressed. Data are representative of three independent experiments.
Figure 9
Figure 9
Faim KO retinas are more prone to accumulate ubiquitin aggregates and express more GFAP than WT mice after light damage. Representative images of 4 μm paraffin sections of retinas taken from three-month-old mice exposed to normal light and to light damage for 8 h (LD 8 h) or 24 h (LD 24 h) and immunolabeled for (A) ubiquitin (red) or (B) GFAP (magenta). Nuclei were stained with Hoechst (cyan). (C) Ubiquitin-positive cells in the INL were counted in at least five images per mice (left); total GFAP intensity was quantified using ImageJ software in at least five images per mice (right). Data are plotted as violin plots. Each plot extends from the min to max values and the median is represented by a thick dashed line (n = 4–6 mice/group). Statistical analysis was performed using Two-way ANOVA and Sidak’s post-hoc test; * p < 0.05, ** p < 0.01, **** p < 0.001. GCL: ganglion cell layer; INL: inner nuclear layer; ONL: outer nuclear layer. Scale bar: 20 μm.
Figure 10
Figure 10
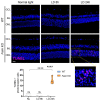
Light-induced retinal cell death in Faim KO mice after 24 h of light exposure at 8000 lux. Representative images of 4 μm paraffin sections of retinas taken from three-month-old mice exposed to normal light and to light damage for 8 h (LD 8 h) or 24 h (LD 24 h) and TUNEL assay was performed (magenta). Nuclei were stained with Hoechst (blue). Total number of TUNEL+ cells per section were counted. Each violin plot extends from the min to max values and the median is represented by a thick dashed line (n = 4–6 mice/group). Statistical analysis was performed using Two-way ANOVA and Sidak’s post-hoc test. **** p < 0.001. GCL: ganglion cell layer; INL: inner nuclear layer; ONL: outer nuclear layer. Scale bar: 20 μm.
Figure 11
Figure 11
RNA-seq data analysis of WT and Faim KO retinas exposed to 24 h LD. (A) Heatmap of RNA-sequencing expression data showing the top genes that are differentially regulated following light damage (LD, 10,000 lux for 24 h) in Faim KO (KO) and WT mice at two–three months of age. (B) Top 15 GO terms enriched in Faim KO mice. Dot size represents the number of genes in the GO term, and color represents the p value.

References

    1. London A., Benhar I., Schwartz M. The retina as a window to the brain—From eye research to CNS disorders. Nat. Rev. Neurol. 2013;9:44–53. doi: 10.1038/nrneurol.2012.227. - DOI - PubMed
    1. De la Rosa E.J., Hernández-Sánchez C. In: CNS targets for the treatment of retinal dystrophies: A Win-Win strategy. Chapter 4 in Therapies for retinal degeneration: Targetting common processes. de la Rosa E.J., Cotter T.G., editors. Volume 2019. Royal Society of Chemistry; London, UK: 2019. pp. 61–75. - DOI
    1. Wang G.-Q.Q., Bai Z.-X.X., Shi J., Luo S., Chang H.-F.F., Sai X.-Y.Y. Prevalence and risk factors for eye diseases, blindness, and low vision in Lhasa, Tibet. Int. J. Ophthalmol. 2013;6:237–241. doi: 10.3980/j.issn.2222-3959.2013.02.24. - DOI - PMC - PubMed
    1. Bourne R.R.A., Steinmetz J.D., Flaxman S., Briant P.S., Taylor H.R., Resnikoff S., Casson R.J., Abdoli A., Abu-Gharbieh E., Afshin A., et al. Trends in prevalence of blindness and distance and near vision impairment over 30 years: An analysis for the Global Burden of Disease Study. Lancet Glob. Health. 2021;9:e130–e143. doi: 10.1016/S2214-109X(20)30425-3. - DOI - PMC - PubMed
    1. Segura M.F., Sole C., Pascual M., Moubarak R.S., Jose Perez-Garcia M., Gozzelino R., Iglesias V., Badiola N., Bayascas J.R., Llecha N., et al. The Long Form of Fas Apoptotic Inhibitory Molecule Is Expressed Specifically in Neurons and Protects Them against Death Receptor-Triggered Apoptosis. J. Neurosci. 2007;27:11228–11241. doi: 10.1523/JNEUROSCI.3462-07.2007. - DOI - PMC - PubMed

Publication types