Automatic Detection of Aerobic Threshold through Recurrence Quantification Analysis of Heart Rate Time Series
- PMID: 36767364
- PMCID: PMC9916349
- DOI: 10.3390/ijerph20031998
Automatic Detection of Aerobic Threshold through Recurrence Quantification Analysis of Heart Rate Time Series
Abstract
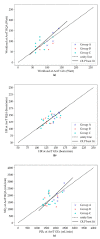
During exercise with increasing intensity, the human body transforms energy with mechanisms dependent upon actual requirements. Three phases of the body's energy utilization are recognized, characterized by different metabolic processes, and separated by two threshold points, called aerobic (AerT) and anaerobic threshold (AnT). These thresholds occur at determined values of exercise intensity(workload) and can change among individuals. They are considered indicators of exercise capacities and are useful in the personalization of physical activity plans. They are usually detected by ventilatory or metabolic variables and require expensive equipment and invasive measurements. Recently, particular attention has focused on AerT, which is a parameter especially useful in the overweight and obese population to determine the best amount of exercise intensity for weight loss and increasing physical fitness. The aim of study is to propose a new procedure to automatically identify AerT using the analysis of recurrences (RQA) relying only on Heart rate time series, acquired from a cohort of young athletes during a sub-maximal incremental exercise test (Cardiopulmonary Exercise Test, CPET) on a cycle ergometer. We found that the minima of determinism, an RQA feature calculated from the Recurrence Quantification by Epochs (RQE) approach, identify the time points where generic metabolic transitions occur. Among these transitions, a criterion based on the maximum convexity of the determinism minima allows to detect the first metabolic threshold. The ordinary least products regression analysis shows that values of the oxygen consumption VO2, heart rate (HR), and Workload correspondent to the AerT estimated by RQA are strongly correlated with the one estimated by CPET (r > 0.64). Mean percentage differences are <2% for both HR and VO2 and <11% for Workload. The Technical Error for HR at AerT is <8%; intraclass correlation coefficients values are moderate (≥0.66) for all variables at AerT. This system thus represents a useful method to detect AerT relying only on heart rate time series, and once validated for different activities, in future, can be easily implemented in applications acquiring data from portable heart rate monitors.
Keywords: aerobic transition; determinism; heart rate; non-linear time series analysis; physical exercise; ventilatory threshold.
Conflict of interest statement
The authors declare no conflict of interest.
Figures


References
-
- Zimatore G., Gallotta M.C., Campanella M., Skarzynski P.H., Maulucci G., Serantoni C., De Spirito M., Curzi D., Guidetti L., Baldari C., et al. Detecting Metabolic Thresholds from Nonlinear Analysis of Heart Rate Time Series: A Review. IJERPH. 2022;19:12719. doi: 10.3390/ijerph191912719. - DOI - PMC - PubMed
-
- Bompa T.O., Buzzichelli C. Periodization: Theory and Methodology of Training. Human Kinetics; Champaign, IL, USA: 2019.
MeSH terms
LinkOut - more resources
Full Text Sources

