. 2023 Jan 18;24(3):1864.
doi: 10.3390/ijms24031864.

Dietary-Induced Bacterial Metabolites Reduce Inflammation and Inflammation-Associated Cancer via Vitamin D Pathway

Affiliations

Dietary-Induced Bacterial Metabolites Reduce Inflammation and Inflammation-Associated Cancer via Vitamin D Pathway

Caitlin O'Mahony et al. Int J Mol Sci. .

Abstract

Environmental factors, including westernised diets and alterations to the gut microbiota, are considered risk factors for inflammatory bowel diseases (IBD). The mechanisms underpinning diet-microbiota-host interactions are poorly understood in IBD. We present evidence that feeding a lard-based high-fat (HF) diet can protect mice from developing DSS-induced acute and chronic colitis and colitis-associated cancer (CAC) by significantly reducing tumour burden/incidence, immune cell infiltration, cytokine profile, and cell proliferation. We show that HF protection was associated with increased gut microbial diversity and a significant reduction in Proteobacteria and an increase in Firmicutes and Clostridium cluster XIVa abundance. Microbial functionality was modulated in terms of signalling fatty acids and bile acids (BA). Faecal secondary BAs were significantly induced to include moieties that can activate the vitamin D receptor (VDR), a nuclear receptor richly represented in the intestine and colon. Indeed, colonic VDR downstream target genes were upregulated in HF-fed mice and in combinatorial lipid-BAs-treated intestinal HT29 epithelial cells. Collectively, our data indicate that HF diet protects against colitis and CAC risk through gut microbiota and BA metabolites modulating vitamin D targeting pathways. Our data highlights the complex relationship between dietary fat-induced alterations of microbiota-host interactions in IBD/CAC pathophysiology.

Keywords: bile acids; colitis; colitis-associated cancer; high-fat diet; inflammation; proliferation; vitamin D.


Conflict of interest statement

The authors declare no conflict of interest. The funders had no role in the design of the study, in the collection, analyses, or interpretation of data, in the writing of the manuscript, or in the decision to publish the results.

Figures

Figure 1
Figure 1
High-fat feeding reduces colitis and tumour development. (a) Representative images of the colon with tumours from mice with LF-CAC and HF-CAC at 4× and close-up of tumours, 10×. (b) Number of tumours per mouse fed LF and HF diet. Significance determined by two-tail unpaired Student’s t-test, * p < 0.014. Data are mean ± SEM. n = 8–12 mice per group, representative of two independent experiments. (cj) Representative histology tissue sections stained with haematoxylin and eosin of distal colon from (c) LF- and (d) HF-fed control (Ctr) group; (e,g) LF- and (f,h) HF-fed mice with colitis, and (i) LF- and (j) HF-fed mice with CAC. Pictures in (c–f) are taken at 20× zoom (Bar–100 μm) and black boxes are inset in (g,h), at 40× zoom (Bar–50 μm). Blue arrow indicates neutrophils and black arrow indicates crypt abscess. Pictures in (i,j) are taken at 20× zoom (Bar–100 μm). (k) Histology inflammatory score in LF-/HF-Colitis compared to LF-/HF-Ctr groups, and tumour score in LF-CAC compared to HF-CAC mice. Significances were determined using ANOVA with post-hoc corrections (inflammatory score) and two-tail unpaired Student’s t-test (tumour score). * p < 0.05 HF-CAC vs. LF-CAC; ## p < 0.01 LF-Colitis vs. LF-Ctr. Data are mean ± SEM. n = 6–10 mice per group.
Figure 2
Figure 2
High-fat feeding protects mice from losing body weight upon DSS exposure. Relative body weight change is depicted as a percentage of starting day of diet feeding (day 0). Significances were determined using ANOVA with post-hoc corrections. *** p < 0.001 HF-CAC vs. LF-CAC; # p < 0.05 and ## p < 0.01 LF-Colitis or LF-CAC vs. LF-Ctr; %%% p < 0.001 HF-Colitis and HF-CAC vs. HF-Ctr; $$$ p < 0.001 HF-Colitis vs. LF-Colitis; &&& p < 0.001 HF-Ctr vs. LF-Ctr. Data are mean ± SEM. n = 8–12 mice per group, representative of two independent experiments. Ctr—Control; CAC—colitis-associated cancer.
Figure 3
Figure 3
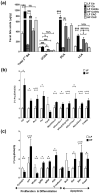
High-fat feeding reduces systemic and mucosal inflammatory markers. (a) Plasma levels of IL-1β, IFN-γ, IL-12p70, and IL-10. Data are mean ± SEM. n = 8–12 mice per group, Significances were determined using ANOVA with post-hoc corrections. # p < 0.05, ## p < 0.01, and ### p < 0.01 LF-Colitis vs. LF-Ctr; % p < 0.05 and %% p < 0.01 HF-CAC vs. HF-Ctr; $ p < 0.05 and $$ p < 0.01 HF-Colitis vs. LF-Colitis. (b) Gene expression of Il-1β, Il-6, iNOS, Il-17a, Cxcl10, Ifn-γ, Il-10, and Foxp3 on tumour-free colonic tissue from mice with CAC fed LF and HF diets, respectively. Expression was determined as n-fold induction compared with the b-actin housekeeping gene and normalised to the LF group. Bars represent the mean ± SEM of three to four mice/group. * p < 0.05 HF-CAC vs. LF-CAC as determined by two-tail unpaired Student’s t-test. (c) Immunophenotyping of splenocytes isolated from LF/HF-fed control and CAC mice. n = 3–12/group. Significances were determined using ANOVA with post-hoc corrections. * p < 0.05 HF-CAC vs. LF-CAC; # p < 0.05 and ## p < 0.01 LF-CAC vs. LF-Ctr. Data is representative of two independent experiments. Ctr—Control; CAC—colitis-associated cancer.
Figure 4
Figure 4
High-fat diet reduces Proteobacteria spp and increases abundance of Clostridium cluster XIV in diseased mice. (a) Microbial distribution in control, colitis and CAC mice fed LF/HF diet on week 5 (W5, DSS-start and 1 week after AOM-injection), W7 (during the first cycle of DSS) and W15 (at the end of the study). All data presented is at the phylum level. (b) Principal coordinates analysis (PCoA) based on Bray–Curtis distance. Ellipses were set to a confidence interval of 80%. Arrows represent Kendall Tau correlations of significantly different genera between the LF-Colitis vs. HF-Colitis and LF-CAC vs. HF-CAC groups. Dashed lines represent an increase in HF, while solid lines show an increase in LF. Black lines show a significant difference in both colitis and CAC disease states, with red being colitis only and blue CAC only. ^ shows significance at the 5% level, ^^ representing the 10% significance level. n = 5–12/group. CAC—colitis-associated cancer.
Figure 5
Figure 5
High-fat diet induces LCA which activates VitD-regulated genes in colonic tissue. (a) Faecal secondary bile acids UCDA, LCA, and DCA. Data are mean ± SEM. n = 4–5 mice per group. Significances were determined using ANOVA with post-hoc corrections. # p < 0.05 and ### p < 0.001 LF-Colitis or LF-CAC vs. LF-Ctr; % p < 0.05, %% p < 0.01, and %%% p < 0.001 HF-Colitis or HF-CAC vs. HF-Ctr; $ p < 0.05, $$ p < 0.01, and $$$ p < 0.001 HF-Colitis vs. LF-Colitis; &&& p < 0.001 HF-Ctr vs. LF-Ctr. (b) Expression of genes in the VitD pathway and (c) of VitD-regulated genes in tumour-free colonic tissue from mice with LF-CAC and HF-CAC. Expression was determined as n-fold induction compared with the β-actin housekeeping gene and normalised to the LF group. Bars represent the mean ± SEM, n = 3–4/group. * p < 0.05 HF-CAC vs. LF-CAC as determined by two-tail unpaired Student’s t-test. Ctr—control; CAC—colitis-associated cancer.
Figure 6
Figure 6
LCA reduces lipid-induced proliferation and induces VitD-regulated genes in intestinal epithelial cells. (a) Representative staining of the proliferation marker Ki67 in colonic tissue sections from LF-/HF-Control (Ctr) and LF-/HF-CAC groups. (b) Number of Ki67+ cells per crypts colonic sections from LF-/HF-Ctr and LF-/HF-CAC groups. n = 4–6 mice/group, 40× magnification. * p < 0.05 HF-CAC vs. LF-CAC and ## p < 0.01 LF-Colitis vs. LF-Ctr determined using ANOVA with post-hoc corrections. (c) Viability, (d) proliferation, and (e) gene expression analysis of VitD genes VDR, PXR, and RXRa on HT29 intestinal epithelial cells after treatment with saturated lipid mixture (lipid), LCA, DCA, lipid + LCA, and lipid + DCA. Bars represent the mean ± SEM. Representative of two to three independent experiments. Significances were determined by ANOVA with post-hoc corrections (c,d) and two-tail unpaired Student’s t-test in (e), * p < 0.05 and ** p < 0.01 untreated vs. Lipid; # p < 0.05 and ## p < 0.01 LCA + Lipid vs. Lipid or LCA + Lipid vs. DCA + Lipid.
Figure 7
Figure 7
Schematic illustration of the impact of high-fat diet on the host, microbiota, and metabolites in regulating intestinal inflammation and cancer.

References

    1. Statovci D., Aguilera M., MacSharry J., Melgar S. The Impact of Western Diet and Nutrients on the Microbiota and Immune Response at Mucosal Interfaces. Front. Immunol. 2017;8:838. doi: 10.3389/fimmu.2017.00838. - DOI - PMC - PubMed
    1. Ananthakrishnan A.N., Bernstein C.N., Iliopoulos D., Macpherson A., Neurath M.F., Raja Ali A.R., Vavricka S.R., Fiocchi C. Environmental triggers in IBD: A review of progress and evidence. Nat. Rev. Gastroenterol. Hepatol. 2018;15:39–49. doi: 10.1038/nrgastro.2017.136. - DOI - PubMed
    1. Ng S.C., Shi H.Y., Hamidi N., Underwood F.E., Tang W., Benchimol E.I., Panaccione R., Ghosh S., Wu J.C.Y., Chan F.K.L., et al. Worldwide incidence and prevalence of inflammatory bowel disease in the 21st century: A systematic review of population-based studies. Lancet. 2017;390:2769–2778. doi: 10.1016/S0140-6736(17)32448-0. - DOI - PubMed
    1. Schirmer M., Garner A., Vlamakis H., Xavier R.X. Microbial genes and pathways in inflammatory bowel disease. Nat. Rev. Microbiol. 2019;17:497–511. doi: 10.1038/s41579-019-0213-6. - DOI - PMC - PubMed
    1. Van Der Kraak L., Gros P., Beauchemin N. Colitis-associated colon cancer: Is it in your genes? World J. Gastroenterol. 2015;21:11688–11699. doi: 10.3748/wjg.v21.i41.11688. - DOI - PMC - PubMed