. 2023 Jan 18;24(3):1924.
doi: 10.3390/ijms24031924.

HIV Replication Increases the Mitochondrial DNA Content of Plasma Extracellular Vesicles

Affiliations

HIV Replication Increases the Mitochondrial DNA Content of Plasma Extracellular Vesicles

Wilfried Wenceslas Bazié et al. Int J Mol Sci. .

Abstract

Extracellular vesicles (EVs) and their cargo have been studied intensively as potential sources of biomarkers in HIV infection; however, their DNA content, particularly the mitochondrial portion (mtDNA), remains largely unexplored. It is well known that human immunodeficiency virus (HIV) infection and prolonged antiretroviral therapy (ART) lead to mitochondrial dysfunction and reduced mtDNA copy in cells and tissues. Moreover, mtDNA is a well-known damage-associated molecular pattern molecule that could potentially contribute to increased immune activation, oxidative stress, and inflammatory response. We investigated the mtDNA content of large and small plasma EVs in persons living with HIV (PLWH) and its implications for viral replication, ART use, and immune status. Venous blood was collected from 196 PLWH, ART-treated or ART-naïve (66 with ongoing viral replication, ≥20 copies/mL), and from 53 HIV-negative persons, all recruited at five HIV testing or treatment centers in Burkina Faso. Large and small plasma EVs were purified and counted, and mtDNA level was measured by RT-qPCR. Regardless of HIV status, mtDNA was more abundant in large than small EVs. It was more abundant in EVs of viremic than aviremic and control participants and tended to be more abundant in participants treated with Tenofovir compared with Zidovudine. When ART treatment was longer than six months and viremia was undetectable, no variation in EV mtDNA content versus CD4 and CD8 count or CD4/CD8 ratio was observed. However, mtDNA in large and small EVs decreased with years of HIV infection and ART. Our results highlight the impact of viral replication and ART on large and small EVs' mtDNA content. The mechanisms underlying the differential incorporation of mtDNA into EVs and their effects on the surrounding cells warrant further investigation.

Keywords: HIV-1; antiretroviral therapy; extracellular vesicles; mitochondrial DNA; tenofovir; zidovudine.


Conflict of interest statement

The authors declare no conflict of interest.

Figures

Figure 1
Figure 1
Mitochondrial DNA content of large and small EVs in viremic and non-viremic participants. (A) HIV-infected versus uninfected participants; (B) in viremic and non-viremic participants irrespective of antiretroviral therapy (ART); (C,D) in viremic and non-viremic participants on ART or not. In graphs, the dots represent individual value and lines the geometric mean with geometric standard deviation factor. Groups were compared using t-tests and ordinary one-way ANOVA with Tukey’s multiple comparisons test.
Figure 2
Figure 2
Mitochondrial DNA in large and small EVs in viremic (A) and aviremic (B) patients on antiretroviral therapy including Zidovudine or Tenofovir for more than six months; in aviremic patients receiving Nevirapine, Efavirenz, or protease inhibitors (C); or a combination of Tenofovir/Emtricitabine/Efavirenz (TDF/FTC/EFV), Zidovudine/lamivudine/Efavirenz (AZT/3TC/EFV), or Zidovudine/lamivudine/Nevirapine (AZT/3TC/NVP) (D). In graphs, the dots represent individual value and lines the geometric mean with geometric standard deviation factor. Group comparisons are based on t-tests and ordinary one-way ANOVA with Tukey’s multiple comparisons test.
Figure 3
Figure 3
Mitochondrial DNA content of large and small EVs in individuals in different categories of CD4 T cell count (A), CD8 T cell count (B), and CD4/CD8 ratio (C). In graphs, the dots represent individual value and lines the mean with the standard error of the mean. Ordinary one-way ANOVA with Tukey’s multiple comparisons was used to reveal significant differences.
Figure 4
Figure 4
Mitochondrial DNA content of large and small EVs in HIV-infected participant subgroups. (A,B) viremic participants; (C,D) aviremic participants. FSW—female sex workers; MSM—men who have sex with men. In graphs, the dots represent individual value and lines the geometric mean with geometric standard deviation factor. Ordinary one-way ANOVA with Tukey’s multiple comparisons test was used to reveal significant differences between groups.
Figure 5
Figure 5
Mitochondrial DNA abundance in large and small EVs in viremic (A,B) and non-viremic (C,D) Tenofovir-treated participants. FSW—female sex workers, MSM—men who have sex with men. In graphs, the dots represent individual value and lines the geometric mean with geometric standard deviation factor. An ordinary one-way ANOVA with Tukey’s multiple comparisons test was used to reveal significant differences between groups.
Figure 6
Figure 6
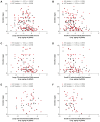
Pearson analysis of correlations between mtDNA abundance in large and small EVs of non-viremic participants and years of HIV+ status or years on ART. (A,B) ART without NRTI drugs; (C,D) Tenofovir-treated participants; (E,F) Zidovudine-treated participants.
Figure 7
Figure 7
Performance of the mtDNA content of large and small EVs as a discriminator of viremic HIV+ patients, based on receiver operating characteristic curve analysis. Large and small EVs mtDNA level was used to generate a Receiver Operator Characteristic (ROC) curve analysis to discriminate viremic participants. Participants with <500 CD8 T cells/µL, ≥500 CD4 T cells/µL, and CD4/CD8 ratio ≥ 1 (group 1, n = 10) were used as controls. Diagnosis performance of large EVs and small EV-mtDNA level for the discrimination of all viremic participants (A,F), viremic female sex workers (B,G), viremic men who have sex with men (C,H), and viremic women (D,I) and men (E,J) from the general population respectively. The Wilson/Brown method was used to compute the area under the curve.

References

    1. van Niel G., D’Angelo G., Raposo G. Shedding light on the cell biology of extracellular vesicles. Nat. Rev. Mol. Cell Biol. 2018;19:213–228. doi: 10.1038/nrm.2017.125. - DOI - PubMed
    1. Raposo G., Stoorvogel W. Extracellular vesicles: Exosomes, microvesicles, and friends. J. Cell Biol. 2013;200:373–383. doi: 10.1083/jcb.201211138. - DOI - PMC - PubMed
    1. Tatischeff I. Current Search through Liquid Biopsy of Effective Biomarkers for Early Cancer Diagnosis into the Rich Cargoes of Extracellular Vesicles. Int. J. Mol. Sci. 2021;22:5674. doi: 10.3390/ijms22115674. - DOI - PMC - PubMed
    1. Nazarenko I. Extracellular Vesicles: Recent Developments in Technology and Perspectives for Cancer Liquid Biopsy. Recent Results Cancer Res. 2020;215:319–344. doi: 10.1007/978-3-030-26439-0_17. - DOI - PubMed
    1. Hubert A., Subra C., Jenabian M.A., Tremblay Labrecque P.F., Tremblay C., Laffont B., Provost P., Routy J.P., Gilbert C. Elevated Abundance, Size, and MicroRNA Content of Plasma Extracellular Vesicles in Viremic HIV-1+ Patients: Correlations With Known Markers of Disease Progression. J. Acquir. Immune Defic. Syndr. 2015;70:219–227. doi: 10.1097/QAI.0000000000000756. - DOI - PMC - PubMed

Substances