. 2023 Jan 19;24(3):1996.
doi: 10.3390/ijms24031996.

Coordinated Loss and Acquisition of NK Cell Surface Markers Accompanied by Generalized Cytokine Dysregulation in COVID-19

Affiliations

Coordinated Loss and Acquisition of NK Cell Surface Markers Accompanied by Generalized Cytokine Dysregulation in COVID-19

Maria O Ustiuzhanina et al. Int J Mol Sci. .

Abstract

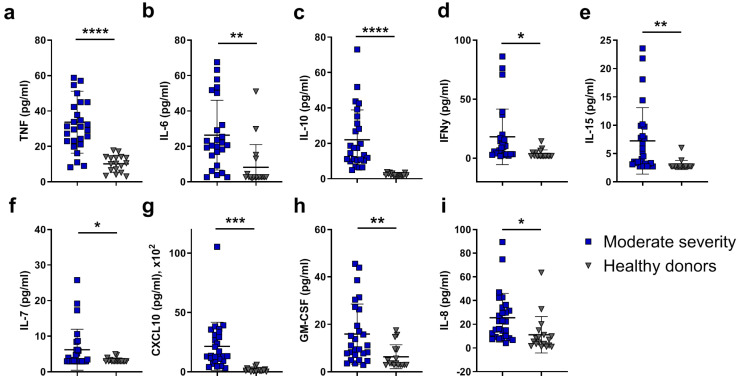
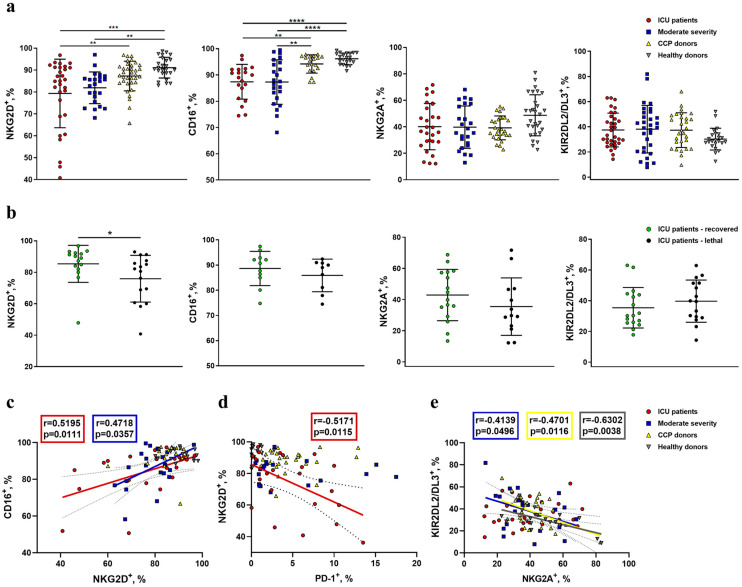
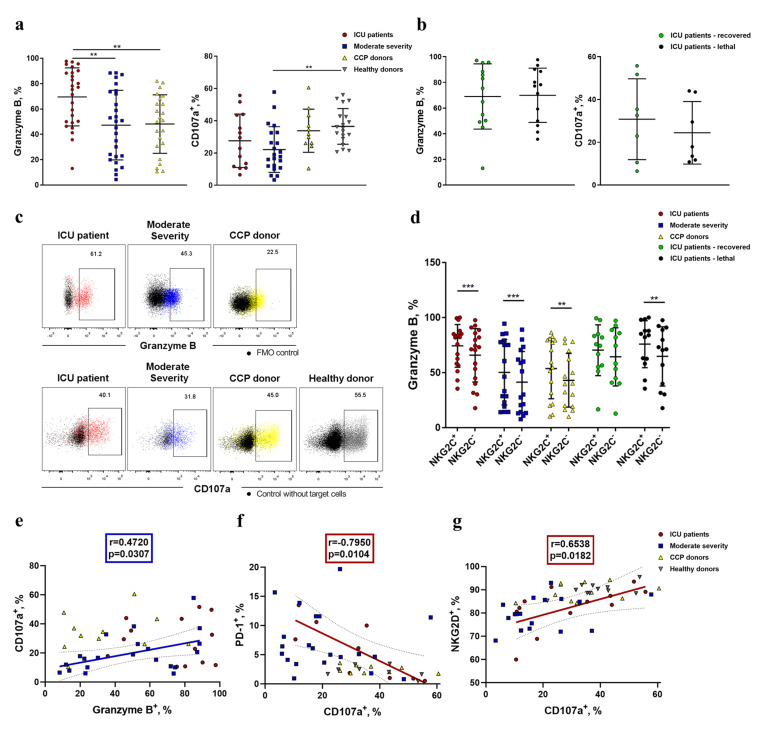
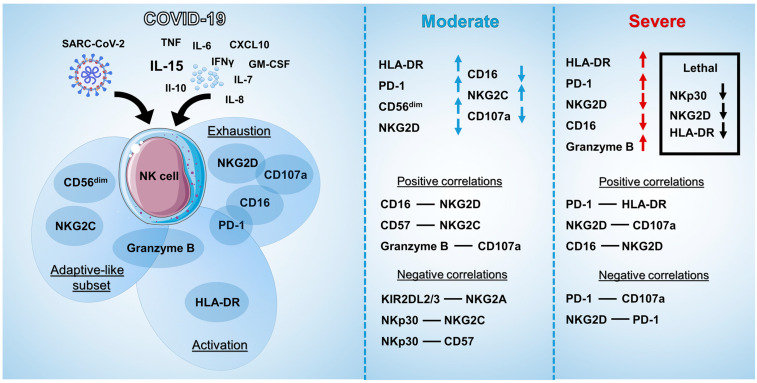
Coronavirus disease 2019 (COVID-19), caused by the SARS-CoV-2 virus, is accompanied by a dysregulated immune response. In particular, NK cells, involved in the antiviral response, are affected by the infection. This study aimed to investigate circulating NK cells with a focus on their activation, depletion, changes in the surface expression of key receptors, and functional activity during COVID-19, among intensive care unit (ICU) patients, moderately ill patients, and convalescents (CCP). Our data confirmed that NK cell activation in patients with COVID-19 is accompanied by changes in circulating cytokines. The progression of COVID-19 was associated with a coordinated decrease in the proportion of NKG2D+ and CD16+ NK cells, and an increase in PD-1, which indicated their exhaustion. A higher content of NKG2D+ NK cells distinguished surviving patients from non-survivors in the ICU group. NK cell exhaustion in ICU patients was additionally confirmed by a strong negative correlation of PD-1 and natural cytotoxicity levels. In moderately ill patients and convalescents, correlations were found between the levels of CD57, NKG2C, and NKp30, which may indicate the formation of adaptive NK cells. A reduced NKp30 level was observed in patients with a lethal outcome. Altogether, the phenotypic changes in circulating NK cells of COVID-19 patients suggest that the intense activation of NK cells during SARS-CoV-2 infection, most likely induced by cytokines, is accompanied by NK cell exhaustion, the extent of which may be critical for the disease outcome.

Keywords: COVID-19; NK cells; SARS-CoV-2; adaptive-like NK cells; coordinative response; cytokines; phenotype.


Conflict of interest statement

The authors declare the absence of obvious and potential conflicts of interest related to the publication of this article.

Figures

Figure 1
Figure 1
The gating strategy for cytometric analysis of NK cells in PBMC samples. Surface expression of PD-1, HLA-DR, NKG2D, CD16, NKG2A, KIR2DL2/DL3, CD57, NKG2C, and NKp30 was analyzed in NK cells by flow cytometry after staining with fluorescent-labeled specific monoclonal antibodies. NK cells were defined as CD3−CD56+ cells in CD45highCD14− cells in the FSC-SSC lymphocyte gate; CD56bright and CD56dim NK cells were determined. SytoxBlue staining was used to detect dying cells.
Figure 2
Figure 2
Peripheral blood levels and viability of lymphocytes from COVID-19 patients, convalescent patients, and healthy donors. (a) CD45highCD14 cell percentage in PBMC was assessed in the following groups: ICU patients (n = 28), moderate-severity patients (n = 28), CCP donors (n = 31), and healthy donors (n = 27). (b) NK cell percentage among CD45highCD14 cells and CD56bright NK cell percentage among all NK cells in blood samples from ICU patients (n = 34), moderate-severity patients (n = 31), CCP donors (n = 31), and healthy donors (n = 48). (c) Percentage of dead cells measured in blood samples from ICU patients (n = 9), moderate-severity patients (n = 15), CCP donors (n = 15), and healthy donors (n = 15). (d) Comparative analysis of CD45highCD14 cell, NK cell, and CD56bright NK cell levels in the recovered and lethal patients from the ICU group. Data are presented as individual values with mean (±SD). * p < 0.05, ** p < 0.01, *** p < 0.001, **** p < 0.0001.
Figure 3
Figure 3
Systemic production of cytokines and chemokines in the blood of patients with moderate-severity disease indicates the activation of a broad immune response. Concentration of (a) TNF, (b) IL-6, (c) IL-10, (d) IFNγ, (e) IL-15, (f) IL-7, (g) CXCL10, (h) GM-CSF, (i) IL-8 in pg/mL in the serum of healthy donors and moderate-severity patients. Data are presented as individual values with mean (±SD). * p < 0.05, ** p < 0.01, *** p < 0.001, **** p < 0.0001.
Figure 4
Figure 4
Analysis of activation and exhaustion markers in NK cells from COVID-19 patients, convalescent patients, and healthy donors. (a) The proportion of HLA-DR+ cells among NK cells and CD56bright and CD56dim subsets in the following comparison groups: ICU patients (n = 23), moderate-severity patients (n = 25), CCP donors (n = 29), and healthy donors (n = 24). (b) The proportion of PD-1+ cells among NK cells and CD56bright and CD56dim subsets in the following comparison groups: ICU patients (n = 31), moderate-severity patients (n = 25), CCP donors (n = 29), and healthy donors (n = 28). (c) Comparative analysis of HLA-DR+ and PD-1+ cell percentages among NK cells and CD56bright and CD56dim subsets in recovered and lethal ICU patients from ICU group. (d) Spearman correlation between HLA-DR and PD-1 expression in all donor groups. (ac) Data are presented as individual values with mean (±SD). * p < 0.05, ** p < 0.01, *** p < 0.001, **** p < 0.0001.
Figure 5
Figure 5
Analysis of NKG2D, CD16, NKG2A, and KIR3DL2/DL3 expression in NK cells from COVID-19 patients, convalescent patients, and healthy donors. (a) The proportion of NKG2D+, CD16+ NKG2A+, and KIR3DL2/DL3+ NK cells measured in the following comparison groups: ICU patients (n = 32, n = 20, n = 27, and n = 27, respectively), moderate-severity patients (n = 23, n = 23, n = 24, and n = 24, respectively), CCP donors (n = 35, n = 20, n = 27, and n = 27, respectively), and healthy donors (n = 27, n = 21, n = 29, and n = 29, respectively). (b) Comparative analysis of NKG2D+, CD16+, NKG2A+, and KIR3DL2/DL3+ NK cells in recovered and lethal ICU patients from the ICU group. (c) Spearman correlation between NKG2D+ and CD16+ NK cell levels in all donor groups. (d) Pearson correlation between NKG2D+ and PD-1+ NK cell levels in all donor groups. (e) Pearson correlation between NKG2A+ and KIR3DL2/DL3+ NK cell levels in all donor groups. (a,b) Data are presented as individual values with mean (±SD). * p < 0.05, ** p < 0.01, *** p < 0.001, **** p < 0.0001.
Figure 6
Figure 6
Analysis of NKG2C, CD57, and NKp30 expression in NK cells from COVID-19 patients, convalescent patients, and healthy donors. (a) The proportion of CD57+, NKG2C+, and NKp30+ NK cells measured in the following comparison groups: ICU patients (n = 32), moderate-severity patients (n = 24), CCP donors (n = 35), and healthy donors (n = 27 for NKp30, n = 62 for CD57 and NKG2C). (b) Comparative analysis of CD57+, NKG2C+, and NKp30+ NK cells in recovered and lethal ICU patients from the ICU group. (c) Pearson correlation between the proportions of CD57+ and NKG2C+ NK cells in all donor groups. (d) Pearson correlation between the proportions of NKp30+ and NKG2C+ NK cells in all donor groups. (e) Pearson correlation between the proportions of NKp30+ and CD57+ NK cells in all donor groups. (a,b) Data are presented as individual values with mean (±SD). * p < 0.05, ** p < 0.01.
Figure 7
Figure 7
Degranulation activity and granzyme B expression in NK cells from COVID-19 patients, convalescent patients, and healthy donors. (a) The proportion of CD107a+ and granzyme B+ NK cells in the following comparison groups: ICU patients (n = 14 and n = 26, respectively), moderate-severity patients (n = 22 and n = 27, respectively), CCP donors (n = 11 and n = 23, respectively), and healthy donors (n = 18 only for CD107a). (b) Comparative analysis of CD107a+ and granzyme B+ NK cell levels in the recovered and non-recovered patient groups from the ICU. (c) Representative dot plots of CD107a and granzyme B expression in NK cells in all studied groups with the respective controls without target cells (K562) or FMO (fluorescence minus one) controls (black), the meaning of other colors is highlighted in the upper part of dot plots. (d) Comparative analysis of granzyme B+ cell level among NKG2C+/− NK cells measured in the following comparison groups: ICU patients (n = 26), moderate-severity patients (n = 27), CCP donors (n = 23), ICU patients—recovered (n = 12), and ICU patients—non-survivors (n = 13). (e) Spearman correlation between the proportions of CD107+ and granzyme B+ NK cells in the studied groups. (f) Pearson correlation between the proportions of CD107+ and PD-1+ NK cells in the studied groups. (g) Spearman correlation between the proportions of CD107+ and NKG2D+ NK cells in the studied groups. (a,b,d) Data are presented as individual values with mean (±SD). ** p < 0.01, *** p < 0.001.
Figure 8
Figure 8
Scheme summarizing the results obtained in the work. Left part represents the main effects of SARS-CoV-2 and cytokines on NK cells’ phenotype and functional activity (adaptive-like subset, activation, and exhaustion). Middle and right parts represent the results of the study, where the significant changes in NK cell markers are highlighted by arrows, and positive and negative correlations are listed for moderate and severe COVID-19 patients.

Similar articles

Cited by

References

    1. COVID Live-Coronavirus Statistics–Worldometer. [(accessed on 22 April 2022)]. Available online: https://www.worldometers.info/coronavirus/
    1. Platto S., Xue T., Carafoli E. COVID19: An Announced Pandemic. Cell Death Dis. 2020;11:799. doi: 10.1038/s41419-020-02995-9. - DOI - PMC - PubMed
    1. Camporota L., Chiumello D., Busana M., Gattinoni L., Marini J.J. Pathophysiology of COVID-19-Associated Acute Respiratory Distress Syndrome. Lancet Respir. Med. 2021;9:e1. doi: 10.1016/S2213-2600(20)30505-1. - DOI - PMC - PubMed
    1. Björkström N.K., Strunz B., Ljunggren H.G. Natural Killer Cells in Antiviral Immunity. Nat. Rev. Immunol. 2022;22:112. doi: 10.1038/s41577-021-00558-3. - DOI - PMC - PubMed
    1. di Vito C., Calcaterra F., Coianiz N., Terzoli S., Voza A., Mikulak J., della Bella S., Mavilio D. Natural Killer Cells in SARS-CoV-2 Infection: Pathophysiology and Therapeutic Implications. Front. Immunol. 2022;13:888248. doi: 10.3389/fimmu.2022.888248. - DOI - PMC - PubMed

Substances