. 2023 Jan 19;24(3):1992.
doi: 10.3390/ijms24031992.

Glycolysis-Related Gene Analyses Indicate That DEPDC1 Promotes the Malignant Progression of Oral Squamous Cell Carcinoma via the WNT/β-Catenin Signaling Pathway

Affiliations

Glycolysis-Related Gene Analyses Indicate That DEPDC1 Promotes the Malignant Progression of Oral Squamous Cell Carcinoma via the WNT/β-Catenin Signaling Pathway

Guangzhao Huang et al. Int J Mol Sci. .

Abstract

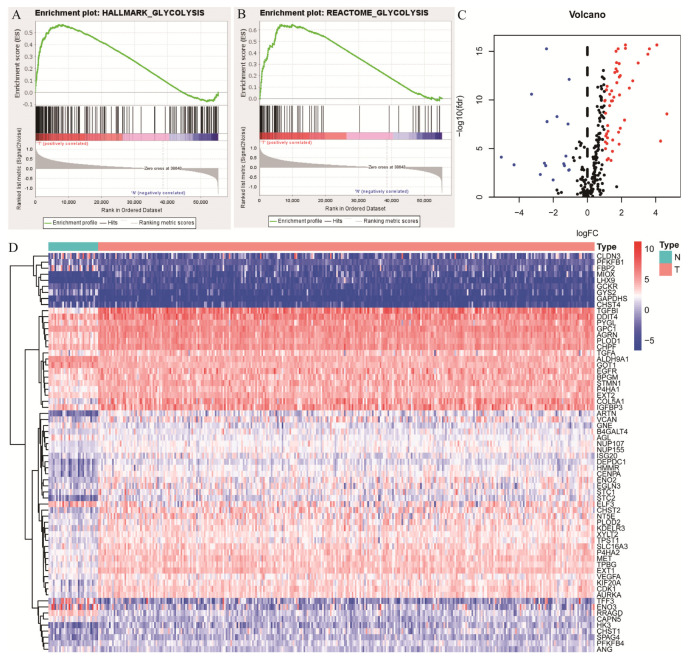
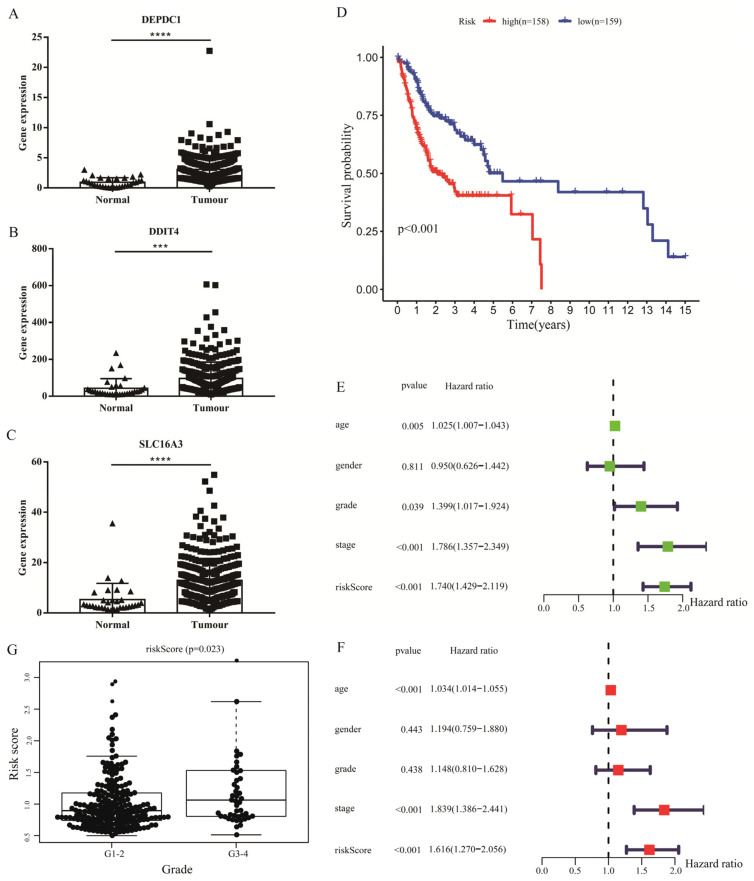
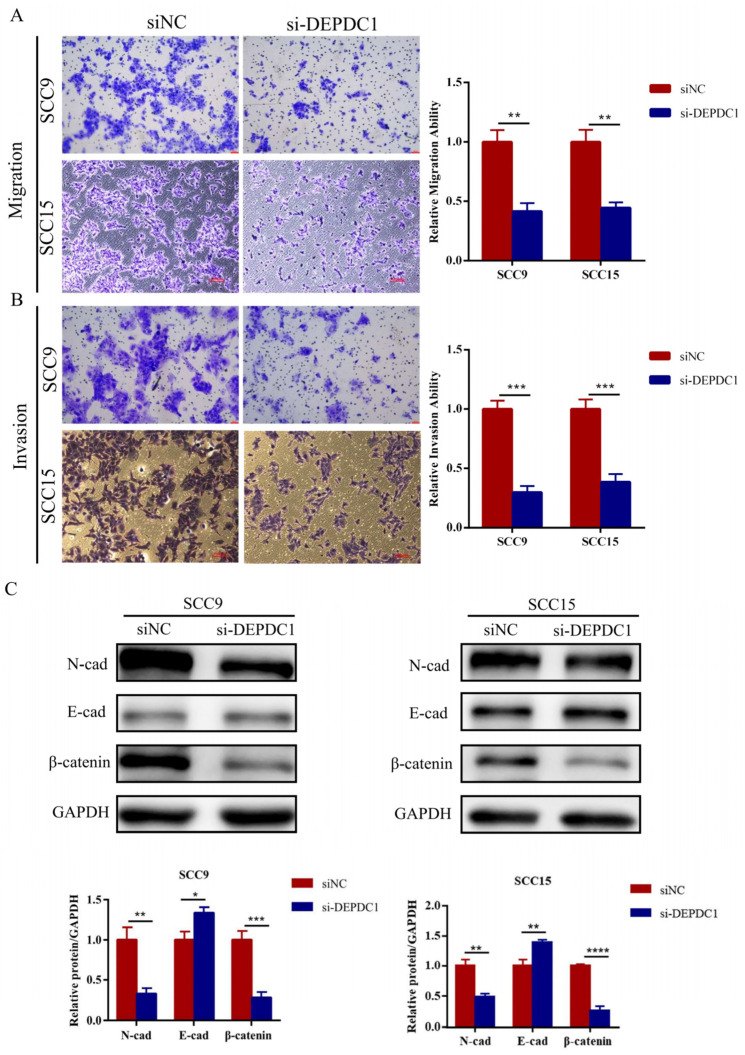
Increasing evidence suggests that aerobic glycolysis is related to the progression of oral squamous cell carcinoma (OSCC). Hence, we focused on glycolysis-related gene sets to screen for potential therapeutic targets for OSCC. The expression profiles of OSCC samples and normal controls were obtained from The Cancer Genome Atlas (TCGA). Then, the differentially expressed gene sets were selected from the official GSEA website following extraction of the differentially expressed core genes (DECGs). Subsequently, we tried to build a risk model on the basis of DECGs to predict the prognosis of OSCC patients via Cox regression analysis. Furthermore, crucial glycolysis-related genes were selected to explore their biological roles in OSCC. Two active glycolysis-related pathways were acquired and 66 DECGs were identified. Univariate Cox regression analysis showed that six genes, including HMMR, STC2, DDIT4, DEPDC1, SLC16A3, and AURKA, might be potential prognostic factors. Subsequently, a risk formula consisting of DEPDC1, DDIT4, and SLC16A3 was established on basis of the six molecules. Furthermore, DEPDC1 was proven to be related to advanced stage cancer and lymph node metastasis. Moreover, functional experiments suggested that DEPDC1 promoted the aerobic glycolysis, migration, and invasion of OSCC via the WNT/β-catenin pathway. The risk score according to glycolysis-related gene expression might be an independent prognostic factor in OSCC. In addition, DEPDC1 was identified as playing a carcinogenic role in OSCC progression, suggesting that DEPDC1 might be a novel biomarker and therapeutic target for OSCC.

Keywords: DEPDC1; OSCC; bioinformatics; glycolysis.


Conflict of interest statement

All the authors declare that they have no competing interests.

Figures

Figure 1
Figure 1
Gene set enrichment analysis (GSEA) screening of glycolysis-related gene sets. (A,B); Hallmark−glycolysis and reactome−glycolysis were significantly activated in OSCC. Higher hallmark−glycolysis and reactome−glycolysis activation were positively related to tumor samples. (C,D), The heatmap and volcano plot of differentially expressed core genes (DECGs) in these 2 gene sets. Blue and red stand for downregulation and upregulation, respectively.
Figure 2
Figure 2
Identification of prognostic Cox model. The expression level of 3 genes, DEPDC1 ((A), p < 0.0001), DDIT4 ((B), p = 0.0008) and SLC16A3 ((C), p < 0.0001), included in the risk Cox formula in TCGA. Triangle and square stand for gene expression level in normal and tumor samples, respectively. (D); Survival analysis between high- and low-risk levels according to risk scores calculated from the DEPDC1, DDIT4 and SLC16A3 expression profiles of each patient. (E,F), Univariate and multivariate Cox regression analyses on the basis of risk score. (G), High risk score might mean poor grade level in OSCC. Significant differences were considered at p < 0.001 ***; and p < 0.0001 ****.
Figure 3
Figure 3
DEPDC1 was identified as a potential biomarker. (A), Survival analysis showed that high DEPDC1 expression levels meant poor overall survival. (B,C), DEPDC1 expression level was related to advanced stage and lymph node metastasis in OSCC. (D,E), GSEA suggested that high DEPDC1 expression was associated with higher activation of the WNT/β−catenin signaling pathway.
Figure 4
Figure 4
Knockdown of DEPDC1 inhibited the migration and invasion of OSCC. (A); (B), The migration (SCC9 p = 0.0012, SCC15 p = 0.0010) and invasion abilities (SCC9 p = 0.0002, SCC15 p = 0.0005) of SCC9 and SCC15 were inhibited after knockdown of DEPDC1. (C); Knockdown of DEPDC1 resulted in a decrease in N-cad (SCC9 p = 0.0024, SCC15 p = 0.0022) and β-catenin (SCC9 p = 0.0007, SCC15 p < 0.0001), and an increase in E-cad (SCC9 p = 0.0102, SCC15 p = 0.0040). Error bars in the graphs represent S.D. N-cad: N-cadherin, E-cad: E-cadherin, siNC: negative control of siRNA, si-DEPDC1: knockdown of DEPDC1. Significant differences were considered at p < 0.05 *; p < 0.01 **; p < 0.001 ***; and p < 0.0001 ****.
Figure 5
Figure 5
DEPDC1 promoted OSCC progression via the WNT/β-catenin signaling pathway. (A,B), Overexpression of DEPDC1 enhanced the migration and invasion of SCC9 and SCC15, while XAV939, an inhibitor of the WNT/β-catenin signaling pathway, could weaken the migration (SCC9 p = 0.0039; p = 0.0081, SCC15 p = 0.0024; p = 0.0134) and invasion ability (SCC9 p = 0.0005; p = 0.0138, SCC15 p = 0.0005; p = 0.0011) after overexpression of DEPDC1. (C), Meanwhile, upregulation of DEPDC1 induced higher N-cad (SCC9 p = 0.0024; p = 0.0042, SCC15 p = 0.0002; p = 0.0012) and β-catenin expression (SCC9 p = 0.0021; p = 0.0114, SCC15 p = 0.0014; p = 0.0075) and lower E-cad expression (SCC9 p = 0.0047; p = 0.0131, SCC15 p = 0.0064; p = 0.0004), while the protein level could also be reversed by XAV939. N-cad: N-cadherin, E-cad: E-cadherin, Con: control, OE: overexpression of DEPDC1. Significant differences were considered at p < 0.05 *; p < 0.01 **; p < 0.001 ***.
Figure 6
Figure 6
DEPDC1 promoted the aerobic glycolysis of OSCC. (A), Knockdown of DEPDC1 showed lower accumulation of lactate (SCC9 p = 0.0251, SCC15 p = 0.0023) and glucose uptake (SCC9 p = 0.0121, SCC15 p = 0.0035) in OSCC. (B), Lactic acid production (SCC9 p = 0.0051; p < 0.0001, SCC15 p = 0.0002; p < 0.0001) and glucose uptake (SCC9 p = 0.0067; p = 0.4904, SCC15 p = 0.0005; p = 0.0023) induced by DEPDC1 could be inhibited by XAV939. (C,D), Glut1 protein levels after knockdown (SCC9 p = 0.0004, SCC15 p = 0.0140) or overexpression (SCC9 p = 0.0013; p = 0.0072, SCC15 p = 0.0007; p = 0.1741) of DEPDC1 in SCC9 and SCC15. Con: control, OE: overexpression of DEPDC1. Significant differences were considered at p < 0.05 *; p < 0.01 **; p < 0.001 ***; and p < 0.0001 ****.

References

    1. Kaminagakura E., Tango R.N., Cruz-Perez D., Bonan R., de Almeida L.Y., Lança M.L.A., Bonan P., Martins H., Takahama A., Jr., Ito F.A., et al. Oral squamous cell carcinoma outcome in adolescent/young adult: Systematic review and m eta-analysis. Head Neck. 2022;44:548–561. doi: 10.1002/hed.26940. - DOI - PubMed
    1. Takahashi H., Yanamoto S., Yamada S., Umeda M., Shigeta T., Minamikawa T., Shibuya Y., Komori T., Shiraishi T., Asahina I., et al. Effects of postoperative chemotherapy and radiotherapy on patients with squamous cell carcinoma of the oral cavity and multiple regional lymph node metastases. Int. J. Oral Maxillofac. Surg. 2014;43:680–685. doi: 10.1016/j.ijom.2013.11.013. - DOI - PubMed
    1. Judge A., Dodd M.S. Metabolism. Essays Biochem. 2020;64:607–647. doi: 10.1042/EBC20190041. - DOI - PMC - PubMed
    1. Sun L., Suo C., Li S.-T., Zhang H., Gao P. Metabolic reprogramming for cancer cells and their microenvironment: Beyond the Warburg Effect. Biochim. Biophys. Acta (BBA) Rev. Cancer. 2018;1870:51–66. doi: 10.1016/j.bbcan.2018.06.005. - DOI - PubMed
    1. Warburg O. On the Origin of Cancer Cells. Science. 1956;123:309–314. doi: 10.1126/science.123.3191.309. - DOI - PubMed

MeSH terms