. 2023 Jan 19;24(3):2013.
doi: 10.3390/ijms24032013.

Closing the Gap between the Auditory Nerve and Cochlear Implant Electrodes: Which Neurotrophin Cocktail Performs Best for Axonal Outgrowth and Is Electrical Stimulation Beneficial?

Affiliations

Closing the Gap between the Auditory Nerve and Cochlear Implant Electrodes: Which Neurotrophin Cocktail Performs Best for Axonal Outgrowth and Is Electrical Stimulation Beneficial?

Dominik Schmidbauer et al. Int J Mol Sci. .

Abstract

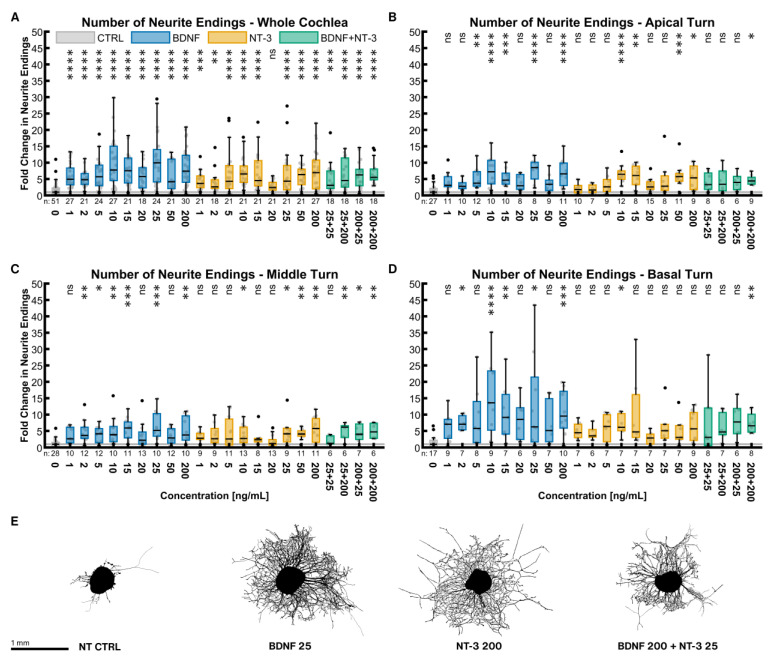
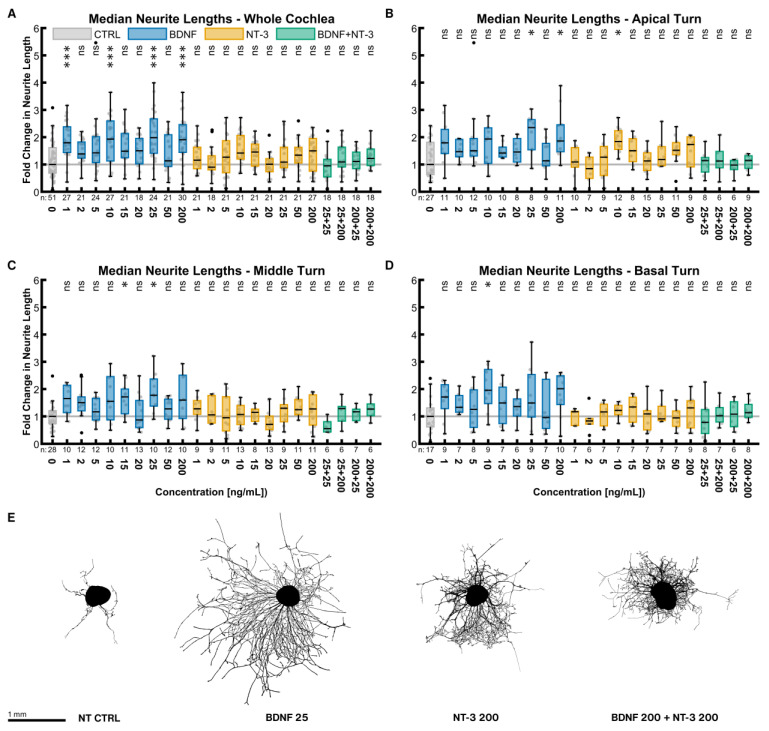
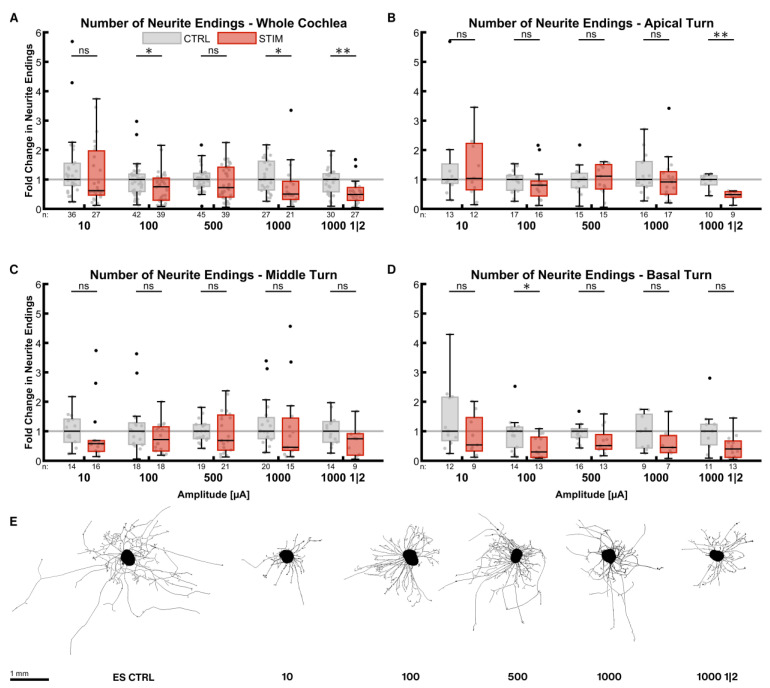
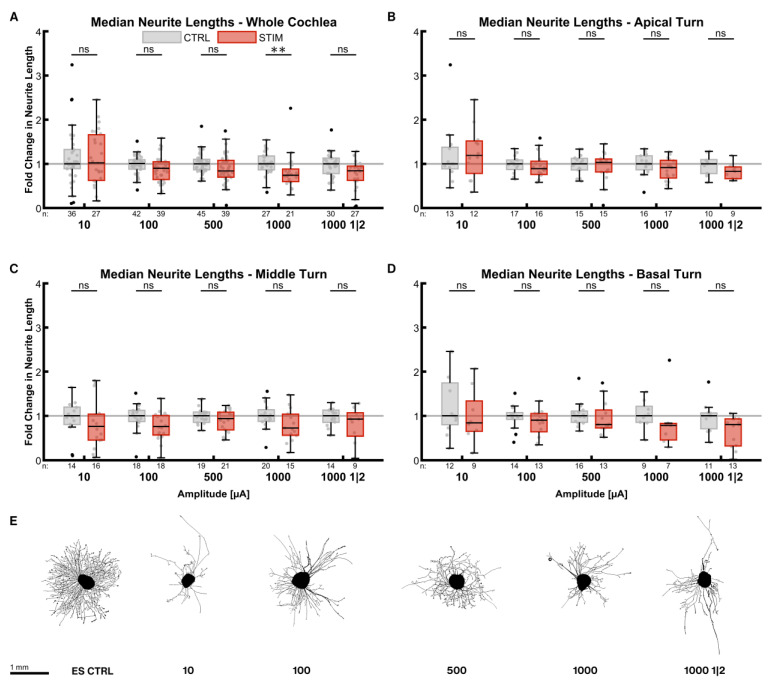
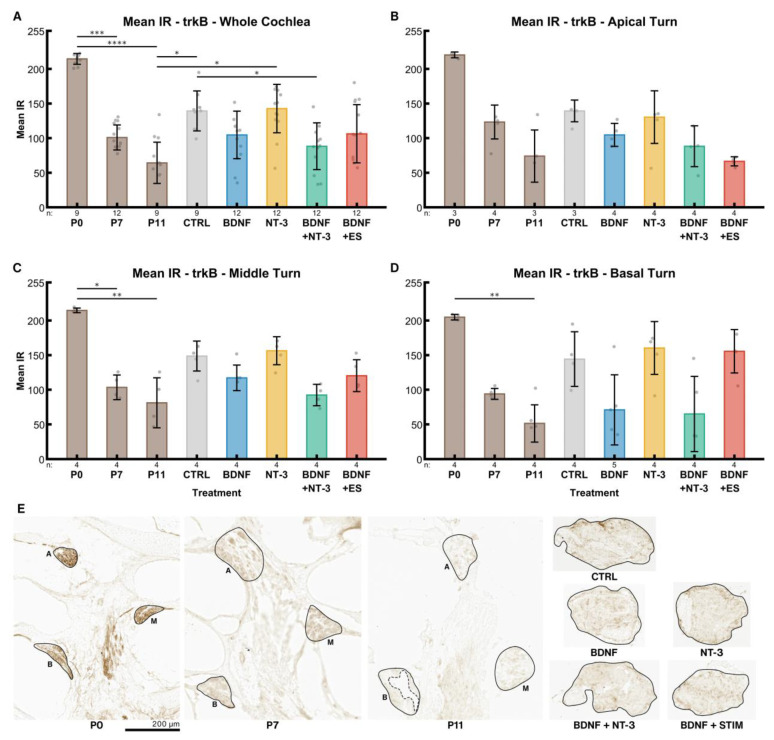
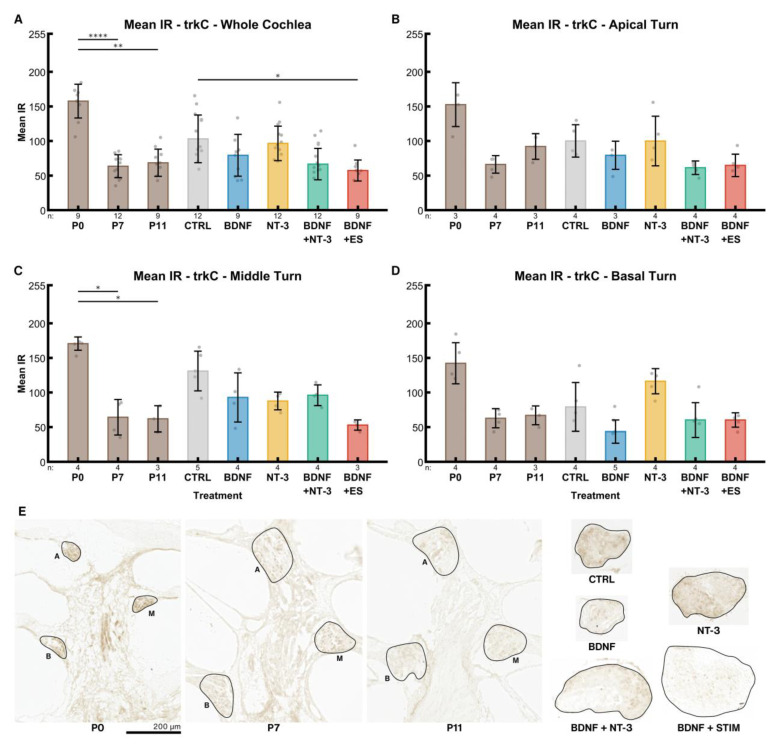
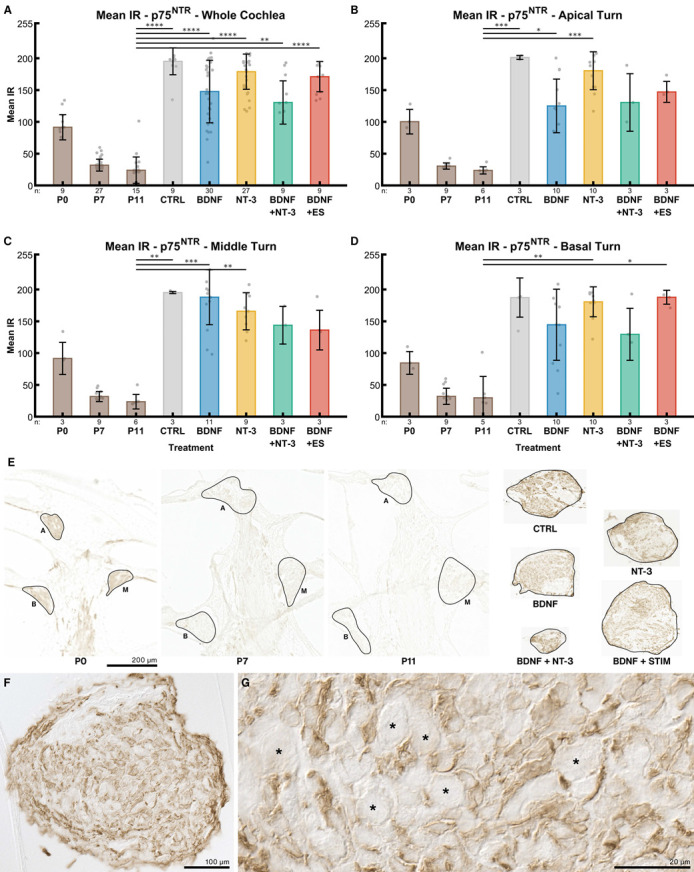
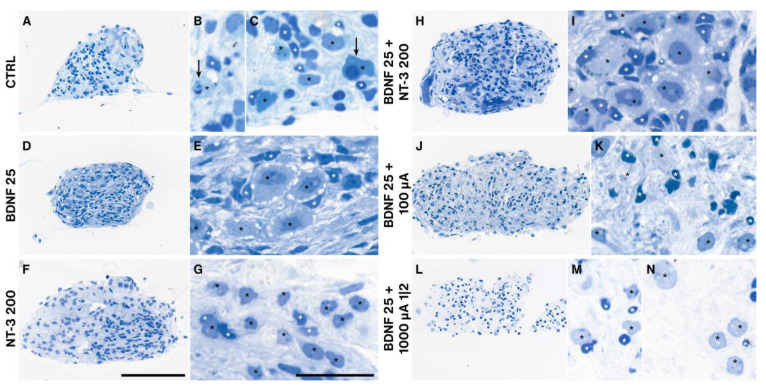
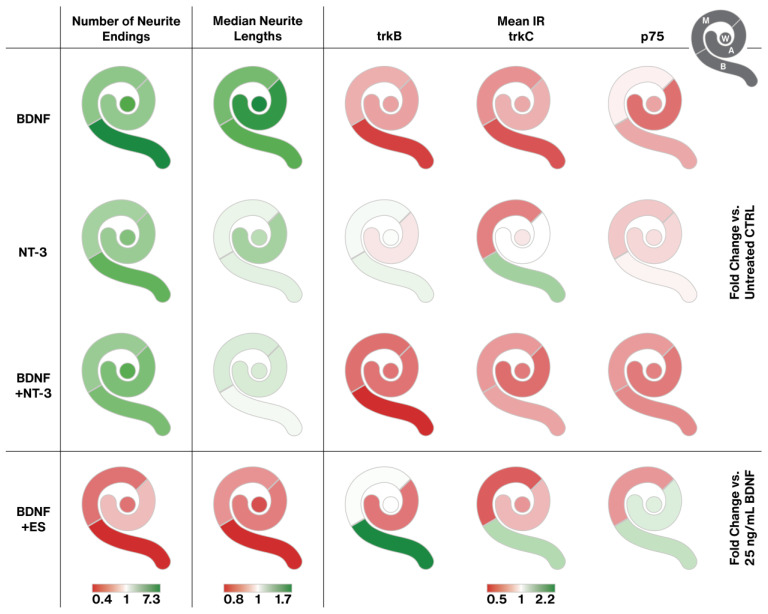
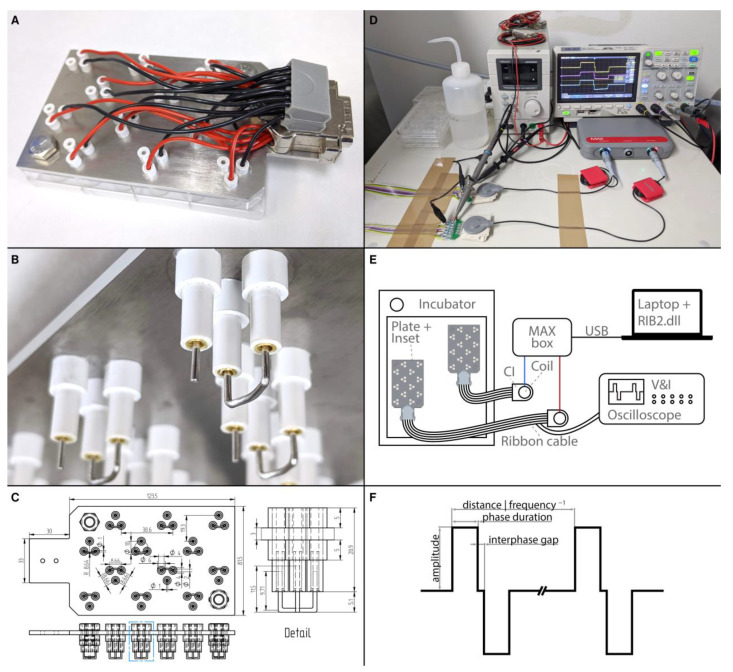
Neurotrophins promote neurite outgrowth of auditory neurons and may help closing the gap to cochlear implant (CI) electrodes to enhance electrical hearing. The best concentrations and mix of neurotrophins for this nerve regrowth are unknown. Whether electrical stimulation (ES) during outgrowth is beneficial or may direct axons is another open question. Auditory neuron explant cultures of distinct cochlear turns of 6-7 days old mice were cultured for four days. We tested different concentrations and combinations of BDNF and NT-3 and quantified the numbers and lengths of neurites with an advanced automated analysis. A custom-made 24-well electrical stimulator based on two bulk CIs served to test different ES strategies. Quantification of receptors trkB, trkC, p75NTR, and histological analysis helped to analyze effects. We found 25 ng/mL BDNF to perform best, especially in basal neurons, a negative influence of NT-3 in combined BDNF/NT-3 scenarios, and tonotopic changes in trk and p75NTR receptor stainings. ES largely impeded neurite outgrowth and glia ensheathment in an amplitude-dependent way. Apical neurons showed slight benefits in neurite numbers and length with ES at 10 and 500 µA. We recommend BDNF as a potent drug to enhance the man-machine interface, but CIs should be better activated after nerve regrowth.

Keywords: cochlear implant; electrical stimulation; nerve regeneration; neurotrophin treatment; spiral ganglion.


Conflict of interest statement

Dominik Schmidbauer started to work at MED-EL after the experimental work was finished but before the first submission of the present work. The other authors declare no conflict of interest.

Figures

Figure 1
Figure 1
Number of neurite endings with neurotrophic supplementation. The diagrams (AD) show the fold change of the number of neurite endings regarding the median of the NT control group with different neurotrophic supplementations. The groups in the first graph (A) contain an equal number of samples from three turns, hence representing the whole cochlea. Diagrams (BD) depict the individual turns. (AD) The boxes extend from the 25% to the 75% percentile. The black bar denotes the median. The whiskers delimit the 1.5-fold interquartile range. Samples within this range are marked as grey dots, and samples beyond this range are black. A grey line marks the median of the control group. The number of samples in each group is written right below the X-axis. The asterisks or ns (not significant) above the groups indicate the significance level of a Kruskal–Wallis test followed by a Dunn’s multi-comparison post-hoc test against the control group. (E) Representative explants at the median of the best-performing groups in (A).
Figure 2
Figure 2
Median neurite lengths with neurotrophic supplementation. The diagrams (AD) show the fold change of the median neurite length of every explant regarding the median of the control group with different neurotrophic supplementations. The groups in the first graph (A) contain an equal number of samples from three turns, hence representing the whole cochlea. Diagrams (BD) depict the individual turns. (AD) The boxes extend from the 25% to the 75% percentile. The black bar denotes the median. The whiskers delimit the 1.5-fold interquartile range. Samples within this range are marked as grey dots, and samples beyond this range are black. A grey line marks the median of the control group. The number of samples in each group is written right below the X-axis. The asterisks or ns (not significant) above the groups indicate the significance level of a Kruskal–Wallis test followed by a Dunn’s multi-comparison post-hoc test against the control group. (E) Representative explants at the median of the best-performing groups in (A).
Figure 3
Figure 3
Number of neurite endings after electrical stimulation. The diagrams (AD) show the fold change of the number of neurite endings regarding the median of the control group after ES with different amplitudes. All groups were supplemented with 25 ng/mL BDNF. The fold change was normalized to the electrically unstimulated controls on the same plate. Therefore, every electrically stimulated group has its own unstimulated control group. 1000 1|2 designates the 1 min on, 2 min off stimulation pattern with 1000 µA amplitude. The groups in the first graph (A) contain an equal number of samples from three turns, hence representing the whole cochlea. Diagrams (BD) depict the individual turns. (AD) The boxes extend from the 25% to the 75% percentile. The black bar denotes the median. The whiskers delimit the 1.5-fold interquartile range. Samples within this range are marked as grey dots, and samples beyond this range are black. A grey line marks the median of the control group. The number of samples in each group is written right below the X-axis. The asterisks or ns (not significant) above the groups indicate the significance level of a groupwise Mann–Whitney test, followed by a Holm–Šídák correction against the corresponding control group. (E) Representative explants at the median of the best-performing groups in (A).
Figure 4
Figure 4
Median neurite lengths after electrical stimulation. The diagrams (AD) show the fold change of the median neurite length regarding the median of the control group after ES with different amplitudes. All groups were supplemented with 25 ng/mL BDNF. The fold change was normalized to the electrically unstimulated controls on the same plate. Therefore, every electrically stimulated group has its own unstimulated control group. 1000 1|2 designates the 1 min on, 2 min off stimulation pattern with 1000 µA amplitude. The groups in the first graph (A) contain an equal number of samples from three turns, hence representing the whole cochlea. Diagrams (BD) depict the individual turns. (AD) The boxes extend from the 25% to the 75% percentile. The black bar denotes the median. The whiskers delimit the 1.5-fold interquartile range. Samples within this range are marked as grey dots, and samples beyond this range are black. A grey line marks the median of the control group. The number of samples in each group is written right below the X-axis. The asterisks or ns (not significant) above the groups indicate the significance level of a groupwise Mann–Whitney test, followed by a Holm–Šídák correction against the corresponding control group. (E) Representative explants at the median of the best-performing groups in (A).
Figure 5
Figure 5
Growth direction angles. Polar histograms of the growth directions of every neurite from all electrically unstimulated (A, n = 112,850) and stimulated (B, n = 73,117) explants. The histograms are divided into 10° bins.
Figure 6
Figure 6
TrkB receptor expression. The diagrams (AD) show the mean IRs of DAB-positive areas of histological sections in different age groups (P0–P11) and explants after different treatments (untreated (NT CTRL), 25 ng/mL BDNF, 200 ng/mL NT-3, 25 ng/mL BDNF + 200 ng/mL NT-3 and 25 ng/mL BDNF + 500 µA). The groups in the first graph (A) contain an equal number of samples from three turns, hence representing the whole cochlea. Diagrams (BD) depict the individual turns. (AD) The whiskers denote the standard deviation. Individual samples are marked as grey dots. The number of samples in each group is written right below the X-axis. The asterisks or ns (not significant) above the groups indicate the significance level of a Kruskal–Wallis test followed by a Dunn’s multi-comparison post-hoc test. The DAB intensities of P0–P11 pups were tested among themselves, and the treated explants were compared with the control and the P11 group. Non-significant differences between groups are not highlighted. (E) Representative sections closest to the median mean IR of the groups in (A). The solid black lines mark the regions of interest, and the dashed line represents an exclusion area. A, M and B denote apical, middle, and basal turns, respectively. The explant sections are all from the middle turn.
Figure 7
Figure 7
TrkC receptor expression. The diagrams (AD) show the mean IRs of DAB-positive areas of histological sections in different age groups (P0–P11) and explant sections after different treatments (untreated (NT CTRL), 25 ng/mL BDNF, 200 ng/mL NT-3, 25 ng/mL BDNF + 200 ng/mL NT-3 and 25 ng/mL BDNF + 500 µA). The groups in the first graph (A) contain an equal number of samples from three turns, hence representing the whole cochlea. Diagrams (BD) depict the individual turns. (AD) The whiskers denote the standard deviation. Individual samples are marked as grey dots. The number of samples in each group is written right below the X-axis. The asterisks or ns (not significant) above the groups indicate the significance level of a Kruskal–Wallis test followed by a Dunn’s multi-comparison post-hoc test. The DAB intensities of P0–P11 pups were tested among themselves, and the treated explants were compared with the control and the P11 group. Non-significant differences between groups are not highlighted. (E) Representative sections closest to the median mean IR of the groups in (A). The solid black lines mark the regions of interest. A, M and B denote apical, middle, and basal turns, respectively. The explant sections are all from the middle turn.
Figure 8
Figure 8
p75NTR receptor expression. The diagrams (AD) show the mean IRs of DAB-positive areas of histological sections at different age groups (P0–P11) and explant sections after different treatments (untreated (NT CTRL), 25 ng/mL BDNF, 200 ng/mL NT-3, 25 ng/mL BDNF + 200 ng/mL NT-3 and 25 ng/mL BDNF + 500 µA). The groups in the first graph (A) contain an equal number of samples from three turns, hence representing the whole cochlea. Diagrams (BD) depict the individual turns. (AD) The whiskers denote the standard deviation. Individual samples are marked as grey dots. The number of samples in each group is written right below the X-axis. The asterisks or ns (not significant) above the groups indicate the significance level of a Kruskal–Wallis test followed by a Dunn’s multi-comparison post-hoc test. The DAB intensities of P0–P11 pups were tested among themselves, and the treated explants were compared with the control and the P11 group. Non-significant differences are not shown. (E) Representative sections closest to the median mean IR of the groups in (A). The solid black lines mark the regions of interest. A, M and B denote apical, middle, and basal turns, respectively. The explant sections are all from the middle turn. (F) Overview and detail (G) of a 25 ng/mL BDNF-treated explant. SGNs are marked with an asterisk and do not exhibit any IR, while surrounding cells are considerably stained.
Figure 9
Figure 9
Semithin sections of BDNF and/or NT-3 supplemented, and electrical stimulated explant cultures. Treatments influenced the cell morphology of SGNs (black stars) and ensheathing SGCs (white stars). Control explants without neurotrophic supplementation (AC) exposed many degenerating neurons (arrows) and several SGCs. Explants after 25 ng/mL BDNF treatment (D,E) resembled a normal morphology with many SGCs ensheathing SGNs with big nucleoli. 200 ng/mL NT-3 administration (F,G) resulted in big neurons but fewer SGCs associated with these neurons. Combined BDNF and NT-3 (H,I) application showed a similar appearance as with BDNF alone, while ES at 100 µA (J,K) and 1000 µA and a 1 min on, 2 min off pattern (LN) lead to a marked decline of SGCs. Often SGNs located without their SGCs in the explant tissue (L,N). Scale bars: 100 µm (overview) and 10 µm (detail).
Figure 10
Figure 10
Graphical representation of the main results. Each cochlea pictogram is separated into four segments, representing apical (A), middle (M), and basal (B) explants, as well as the equally pooled, whole cochlea represented as a circle in the middle (W) (see pictogram in the upper right corner). The three gradients at the bottom determine the color range for the first, second, and last three columns, respectively. Each color visualizes the fold change of the median related to the median of the respective untreated (first three rows) or 25 ng/mL BDNF treated (last row) groups. To minimize the influence of variation, the first two columns contain all equally pooled concentrations or stimulation patterns of each agent (BDNF, NT-3, BDNF + NT-3, or BDNF + ES). For the mean IR of the receptor quantification, only distinct treatments were available (25 ng/mL BDNF, 200 ng/mL NT-3, 25 ng/mL BDNF + 200 ng/mL NT-3, 25 ng/mL BDNF + 500 µA ES).
Figure 11
Figure 11
Electrical stimulation setup. (A) Photograph of the electrode inset in a 24-well plate. A set of electrodes is situated within every second well. (B) Detail of the lower part of the electrode inset. Three electrode holders fit into one well. The long and thin tubes are fixed by shorter and wider tubes above (not visible) and below the metal plate. In each holder sits a gold-plated socket that is soldered to a wire. The sockets hold the curved reference electrode as well as the stimulation electrode. (C) Multiview projections (top and side) and dimensions of the base plate, electrode holders, and platinum wires. The detail shows an enlargement of the features within the blue dotted box. Photograph (D) and schematic drawing (E) of the stimulation setup. Shown are two CI stimulators connected via coil transmitters to a MAX box. An oscilloscope monitors the voltage and current of the signal. Two ribbon cables lead into the incubator and are connected to the stimulation insets. (F) Schematic illustration of the stimulation signal and its main parameters.

References

    1. Haile L.M., Kamenov K., Briant P.S., Orji A.U., Steinmetz J.D., Abdoli A., Abdollahi M., Abu-Gharbieh E., Afshin A., Ahmed H., et al. Hearing Loss Prevalence and Years Lived with Disability, 1990-2019: Findings from the Global Burden of Disease Study 2019. Lancet. 2021;397:996–1009. doi: 10.1016/S0140-6736(21)00516-X. - DOI - PMC - PubMed
    1. Shukla A., Harper M., Pedersen E., Goman A., Suen J.J., Price C., Applebaum J., Hoyer M., Lin F.R., Reed N.S. Hearing Loss, Loneliness, and Social Isolation: A Systematic Review. Otolaryngol. Head Neck Surg. 2020;162:622–633. doi: 10.1177/0194599820910377. - DOI - PMC - PubMed
    1. Livingston G., Huntley J., Sommerlad A., Ames D., Ballard C., Banerjee S., Brayne C., Burns A., Cohen-Mansfield J., Cooper C., et al. Dementia Prevention, Intervention, and Care: 2020 Report of the Lancet Commission. Lancet. 2020;396:413–446. doi: 10.1016/S0140-6736(20)30367-6. - DOI - PMC - PubMed
    1. Lin F.R. Hearing Loss and Cognition among Older Adults in the United States. J. Gerontol. Ser. A. 2011;66:1131–1136. doi: 10.1093/gerona/glr115. - DOI - PMC - PubMed
    1. Gstoettner W., Franz P., Hamzavi J., Plenk H., Baumgartner W., Czerny C. Intracochlear Position of Cochlear Implant Electrodes. Acta Otolaryngol. 1999;119:229–233. doi: 10.1080/00016489950181729. - DOI - PubMed

Substances