

Meta-Analysis and Multivariate GWAS Analyses in 80,950 Individuals of African Ancestry Identify Novel Variants Associated with Blood Pressure Traits
- PMID: 36768488
- PMCID: PMC9916484
- DOI: 10.3390/ijms24032164
Meta-Analysis and Multivariate GWAS Analyses in 80,950 Individuals of African Ancestry Identify Novel Variants Associated with Blood Pressure Traits
Erratum in
-
Correction: Udosen et al. Meta-Analysis and Multivariate GWAS Analyses in 80,950 Individuals of African Ancestry Identify Novel Variants Associated with Blood Pressure Traits. Int. J. Mol. Sci. 2023, 24, 2164.Int J Mol Sci. 2024 Apr 7;25(7):4093. doi: 10.3390/ijms25074093. Int J Mol Sci. 2024. PMID: 38612946 Free PMC article.
Abstract
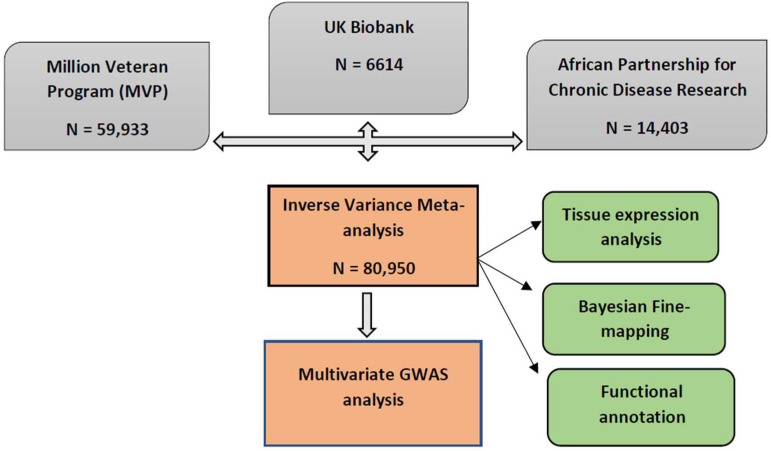
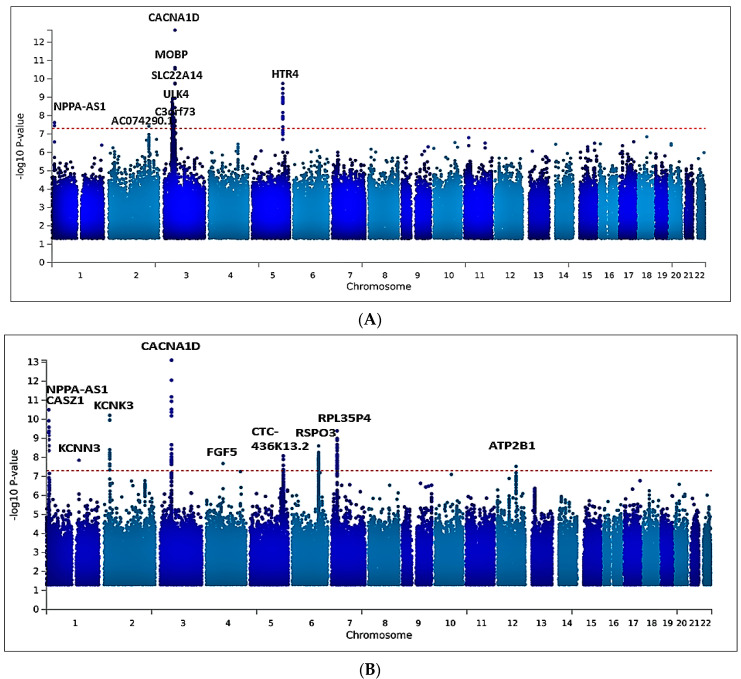
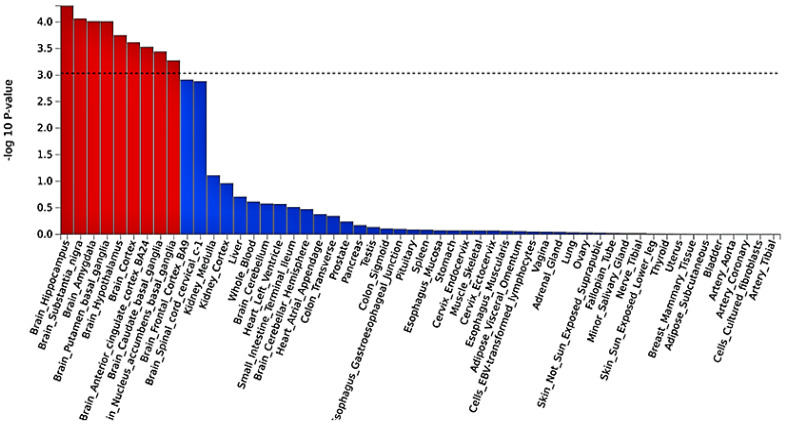
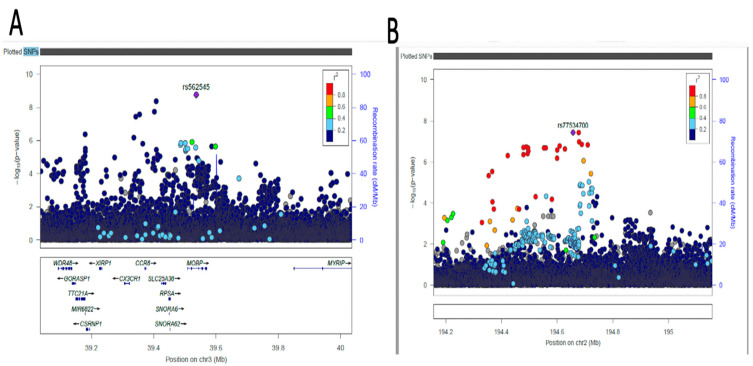
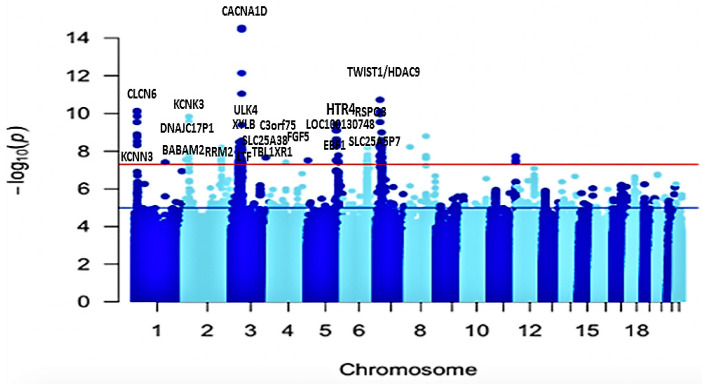
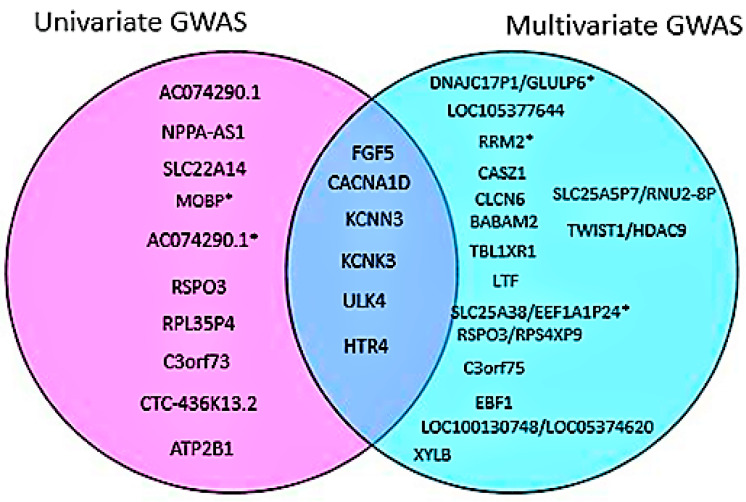
High blood pressure (HBP) has been implicated as a major risk factor for cardiovascular diseases in several populations, including individuals of African ancestry. Despite the elevated burden of HBP-induced cardiovascular diseases in Africa and other populations of African descent, limited genetic studies have been carried out to explore the genetic mechanism driving this phenomenon. We performed genome-wide association univariate and multivariate analyses of both systolic (SBP) and diastolic blood pressure (DBP) traits in 80,950 individuals of African ancestry. We used summary statistics data from six independent cohorts, including the African Partnership for Chronic Disease Research (APCDR), the UK Biobank, and the Million Veteran Program (MVP). FUMA was used to annotate, prioritize, visualize, and interpret our findings to gain a better understanding of the molecular mechanism(s) underlying the genetics of BP traits. Finally, we undertook a Bayesian fine-mapping analysis to identify potential causal variants. Our meta-analysis identified 10 independent variants associated with SBP and 9 with DBP traits. Whilst our multivariate GWAS method identified 21 independent signals, 18 of these SNPs have been previously identified. SBP was linked to gene sets involved in biological processes such as synapse assembly and cell-cell adhesion via plasma membrane adhesion. Of the 19 independent SNPs identified in the BP meta-analysis, only 11 variants had posterior probability (PP) of > 50%, including one novel variant: rs562545 (MOBP, PP = 77%). To facilitate further research and fine-mapping of high-risk loci/variants in highly susceptible groups for cardiovascular disease and other related traits, large-scale genomic datasets are needed. Our findings highlight the importance of including ancestrally diverse populations in large GWASs and the need for diversity in genetic research.
Keywords: GWAS; diastolic blood pressure; high blood pressure; multivariate; systolic blood pressure; univariate.
Conflict of interest statement
The authors declare no conflict of interest.
Figures
References
-
- Feinleib M., Garrison R.J., Fabsitz R., Christian J.C., Hrubec Z., Borhani N.O., Kannel W.B., Rosenman R., Schwartz J.T., Wagner J.O. The Nhlbi Twin Study of Cardiovascular Disease Risk Factors: Methodology and Summary of Results. Am. J. Epidemiol. 1977;106:284–295. doi: 10.1093/oxfordjournals.aje.a112464. - DOI - PubMed
Publication types
MeSH terms
Grants and funding
LinkOut - more resources
Full Text Sources
Medical
Miscellaneous
