. 2023 Jan 23;24(3):2241.
doi: 10.3390/ijms24032241.

Optimizing Axial and Peripheral Substitutions in Si-Centered Naphthalocyanine Dyes for Enhancing Aqueous Solubility and Photoacoustic Signal Intensity

Affiliations

Optimizing Axial and Peripheral Substitutions in Si-Centered Naphthalocyanine Dyes for Enhancing Aqueous Solubility and Photoacoustic Signal Intensity

Mohammad Ahsan Saad et al. Int J Mol Sci. .

Abstract

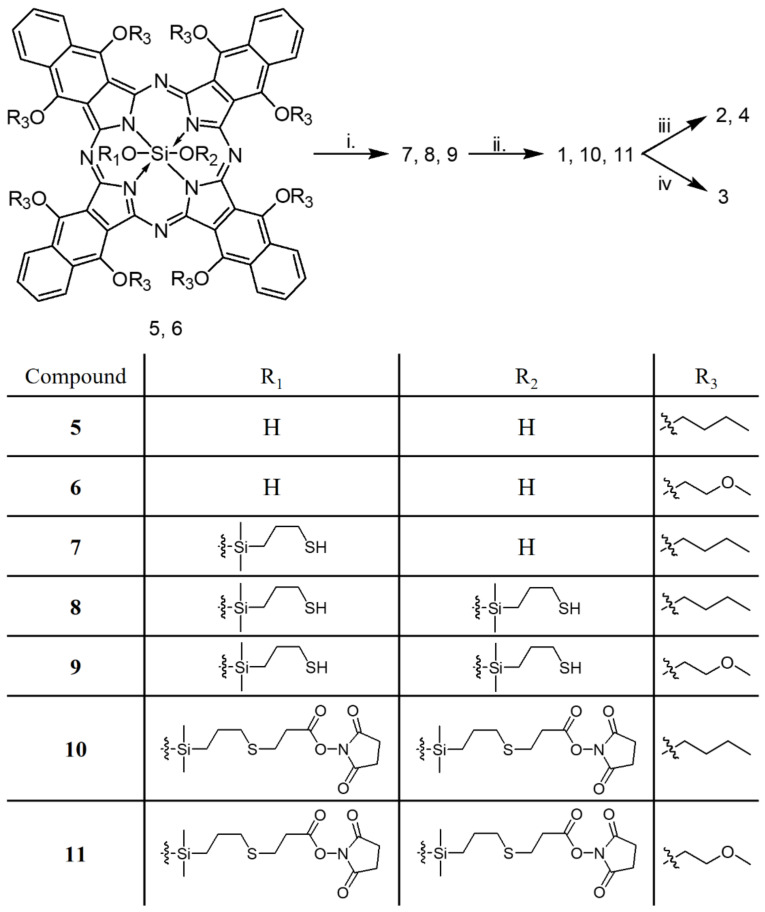
Photoacoustic imaging using external contrast agents is emerging as a powerful modality for real-time molecular imaging of deep-seated tumors. There are several chromophores, such as indocyanine green and IRDye800, that can potentially be used for photoacoustic imaging; however, their use is limited due to several drawbacks, particularly photostability. There is, therefore, an urgent need to design agents to enhance contrast in photoacoustic imaging. Naphthalocyanine dyes have been demonstrated for their use as photoacoustic contrast agents; however, their low solubility in aqueous solvents and high aggregation propensity limit their application. In this study, we report the synthesis and characterization of silicon-centered naphthalocyanine dyes with high aqueous solubility and near infra-red (NIR) absorption in the range of 850-920 nm which make them ideal candidates for photoacoustic imaging. A series of Silicon-centered naphthalocyanine dyes were developed with varying axial and peripheral substitutions, all in an attempt to enhance their aqueous solubility and improve photophysical properties. We demonstrate that axial incorporation of charged ammonium mesylate group enhances water solubility. Moreover, the incorporation of peripheral 2-methoxyethoxy groups at the α-position modulates the electronic properties by altering the π-electron delocalization and enhancing photoacoustic signal amplitude. In addition, all the dyes were synthesized to incorporate an N-hydroxysuccinimidyl group to enable further bioconjugation. In summary, we report the synthesis of water-soluble silicon-centered naphthalocyanine dyes with a high photoacoustic signal amplitude that can potentially be used as contrast agents for molecular photoacoustic imaging.

Keywords: image-guided therapy; naphthalocyanine dyes; photoacoustic imaging; silicon-centered naphthalocyanine dyes; water-soluble naphthalocyanines.


Conflict of interest statement

Scott Selfridge and Robert Pawle are full time employees of Akita Innovations, LLC, a provider of custom designed bioimaging dyes. All other authors declare no competing financial interest.

Figures

Figure 1
Figure 1
Chemical characteristics of silicon naphthalocyanine dyes 1–4 (SiNC(1–4)).
Scheme 1
Scheme 1
Synthesis of silicon naphthalocyanine dyes 1–4 (SiNC(1–4)). (i). Methoxydimethylsilylpropanethiol, pyridine, 130–140 °C, 16 h. (ii). N-succinimidyl acrylate, diisopropylethylamine, dichloromethane, 40 °C, 16 h. (iii). A. Bis(N,N-dimethylaminopropyl)amine, chloroform, 16 h. b. Methyl methane sulfonate, 16 h. (iv). A. Bis(N,N-dimethylaminopropyl)amine, chloroform, 16 h. b. 2,(2-(2-methoxyethoxy))ethoxy)ethoxy mesylate, chloroform, 72 h.
Figure 2
Figure 2
UV−Vis absorption spectra of Silicon-centered naphthalocyanine dyes. (A) SiNC-1, (B) SiNC-2, (C) SiNC-3 and (D) SiNC-4, in selected solvent systems. Red curves are molar extinction coefficients, plotted on the left axis. Blue curves are normalized absorbance data in the denoted solvent, plotted on the right axis. Blue dotted curve in D is the normalized absorbance data in water. DMAC: Dimethylacetamide.
Figure 3
Figure 3
UV-Vis absorption spectra of silicon naphthalocyanine dyes SiNC(1–4), IRDye800 and ICG recorded in PBS with and without 0.1% BSA.
Figure 4
Figure 4
(A) Photoacoustic spectra of silicon naphthalocyanine dyes (SiNC-1–4), IRDye800 and ICG recorded in PBS with (magenta) and without 0.1% BSA (cyan). (B) PA signal intensity of SiNC1–4, IRDye800 and ICG recorded at 880 nm, 775 nm, and 780 nm wavelength illumination, respectively, in the presence and absence of BSA. Inset shows the PA image. Imaging orientation is provided in the inset for ICG/ICG BSA. Photoacoustic signal intensity (a.u.) bar is provided in the right.
Figure 5
Figure 5
(A) Pulse to pulse PA signal of ICG in water acquired with our custom-built photoacoustic imaging system. (B) The total change in PA signal of the various dyes over the course of 3000 nanosecond laser pulses at their wavelengths corresponding to the dye absorption maxima. The results are expressed as mean ± standard deviation (n = 3).
Figure 6
Figure 6
(A) Experimental scheme for photoacoustic imaging. (B) Ultrasound and photoacoustic images of Cal 27 tumor phantoms created after incubating the cells with different dyes at a concentration of 2.5 µM for either 2 h or 24 h. Phantoms created from gelatin and untreated cells were used as controls. Representative PA images of SiNC(1–4), IRDye800 and ICG treated cells recorded at 880 nm, 775 nm, and 780 nm, respectively, Scale bar represents 1 cm. Photoacoustic signal intensity (a.u.) bar is provided in the right.
Figure 7
Figure 7
Comparison of photoacoustic signal intensity from Cal 27 cell phantoms incubated with the different dyes for either 2 h (magenta histograms) or 24 h (cyan histograms). PA signal intensity of SiNC(1–4), IRDye800 and ICG treated cells recorded at 880 nm, 775 nm, and 780 nm, respectively.

Similar articles

Cited by

References

    1. Zhou Y., Yao J., Wang L. Tutorial on photoacoustic tomography. J. Biomed. Opt. 2016;21:061007. doi: 10.1117/1.JBO.21.6.061007. - DOI - PMC - PubMed
    1. Wilson K.E., Wang T.Y., Willmann J.K. Acoustic and Photoacoustic Molecular Imaging of Cancer. J. Nucl. Med. 2013;54:1851–1854. doi: 10.2967/jnumed.112.115568. - DOI - PMC - PubMed
    1. Attia A.B.E., Balasundaram G., Moothanchery M., Dinish U.S., Bi R., Ntziachristos V., Olivo M. A review of clinical photoacoustic imaging: Current and future trends. Photoacoustics. 2019;16:100144. doi: 10.1016/j.pacs.2019.100144. - DOI - PMC - PubMed
    1. Mallidi S., Luke G.P., Emelianov S. Photoacoustic imaging in cancer detection, diagnosis, and treatment guidance. Trends Biotechnol. 2011;29:213–221. doi: 10.1016/j.tibtech.2011.01.006. - DOI - PMC - PubMed
    1. Shrestha B., DeLuna F., Anastasio M.A., Ye J.Y., Brey E.M. Photoacoustic Imaging in Tissue Engineering and Regenerative Medicine. Tissue Eng. Part B Rev. 2020;26:79–102. doi: 10.1089/ten.teb.2019.0296. - DOI - PMC - PubMed