. 2023 Jan 23;24(3):2240.
doi: 10.3390/ijms24032240.

Gestational Diabetes Mellitus and Small-for-Gestational-Age: An Insight into the Placental Molecular Biomarkers

Affiliations

Gestational Diabetes Mellitus and Small-for-Gestational-Age: An Insight into the Placental Molecular Biomarkers

Christian Giommi et al. Int J Mol Sci. .

Abstract

Gestational diabetes mellitus (GDM) and small-for-gestational-age (SGA) are two metabolic-related diseases that could affect women during pregnancy. Considering that the chorionic villi (CVs) are crucial structures for the feto-maternal exchange, the alterations in their conformation have been linked to an imbalanced metabolic environment of placenta. In this study, a multidisciplinary approach has been carried out to describe the changes occurring in the placental CVs of GDM and SGA patients. The results revealed higher levels of superoxide dismutase 1 (SOD-1) and catalase (CAT), especially in the GDM placentae, which could be correlated with the hyperglycemic environment characteristic of this pathology. Furthermore, spectroscopy and histologic analyses revealed that both pathologies modify the placental lipid composition altering its structure. However, SGA induces lipid peroxidation and reduces collagen deposition within the CVs. Since the endocannabinoid system (ECS) is involved in placentation and different metabolic activities, the cannabinoid receptor 1 (CB1) and transient receptor potential cation channel subfamily V member 1 (TRPV-1) were analyzed. No changes have been observed either at general or specific levels in the CVs comparing control and pathological samples, suggesting the non-involvement of the cannabinoid system in these two pathologies.

Keywords: FTIRI; GDM; SGA; endocannabinoid receptors; placenta.


Conflict of interest statement

The authors declare no conflict of interest.

Figures
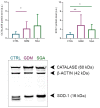
Figure 1
Figure 1
Relative levels of antioxidant enzymes in the control and pathological placenta slices. In the graphs, bars indicate the CATALASE (60 kDa)/β-actin (42 kDa) ratio and SOD-1 (16 kDa)/β-actin (42 kDa) ratio densitometric analysis ± SD of twelve independent replicates (n = 12). Asterisks indicate significant differences (* = p < 0.05; ** = p < 0.01) when comparing the pathologies to the control group. CTRL: control group (blue), GDM: gestational diabetes mellitus (purple), SGA: small-for-gestational-age (green).
Figure 2
Figure 2
Vibrational analysis. Mean infrared spectra of control (CTRL, blue lines), gestational diabetes mellitus (GDM, purple lines), and small-for-gestational-age (SGA, green lines) samples. Spectra are displayed in absorbance (colored continuous lines) and second derivative modes (black dotted lines) in the 3050–2800 cm−1 (A,D,G), 1800–1480 cm−1 (B,E,H), and 1350–1000 cm−1 (C,F,I) intervals.
Figure 3
Figure 3
Multivariate analysis. PCA score plots and corresponding PC1 loadings calculated on CTRL, GDM, and SGA spectral populations in the 3050–2800 cm−1 (A,D and G,J), 1800–1480 cm−1 (B,E and H,K), and 1350–1000 cm−1 (C,F and I,L) intervals. For a better comprehension, PC1 loadings of the three selected intervals are displayed with different Y scales. CTRL: control group (blue), GDM: gestational diabetes mellitus (purple), SGA: small-for-gestational-age (green).
Figure 4
Figure 4
Collagen deposition analysis through histology in the three experimental groups. Masson’s Trichrome staining was performed to analyze the collagen deposition in the CVs (AC). (D) Bars represent collagen deposition in the three conditions expressed as mean ± SD of five independent samples (n = 5). Asterisks indicate significant differences (** = p < 0.01) Representative histological images of the collagen deposition within the CV (black arrowhead) in CTRL (B), GDM (C), and SGA (D) placentae. CTRL: control group (blue), GDM: gestational diabetes mellitus (purple), SGA: small-for-gestational-age (green).
Figure 5
Figure 5
FTIRI analysis of collagen structure in CV sections of CTRL, GDM, and SGA experimental groups. (A) Statistical analysis of the following band area ratios: α Chain/TOT (relative amount of α chain secondary structures in collagen) and Triple Helix/TOT (relative amount of triple helix structures in collagen). TOT was the sum of the areas of all the peaks in the 1350–1000 cm−1 range. Values are reported as mean ± SD of five independent samples (n = 5). Asterisks indicate significant differences between CTRL and GDM and CTRL and SGA groups (* = p < 0.05, *** = p < 0.001, and **** = p < 0.0001). (BD) Microphotographs of representative sections of CTRL, GDM, and SGA groups, and (EG) corresponding false-color images showing the topographical distribution of collagen within the mapped areas; absorbances ranged from white/pink (representing the highest values) to blue/black (representing the lowest ones). CTRL: control group (blue), GDM: gestational diabetes mellitus (purple), SGA: small-for-gestational-age (green).
Figure 6
Figure 6
Lipid content analysis through histology in the three experimental groups. Representative histological images showing the lipid droplets (red arrows) within the CV sections (AC). Analysis of lipid content in CV sections using Oil Red O staining (D). Bars represent lipid content in the three conditions expressed as mean ± SD of five independent samples (n = 5). CTRL: control group (blue), GDM: gestational diabetes mellitus (purple), SGA: small-for-gestational-age (green).
Figure 7
Figure 7
FTIRI analysis of the lipid content and peroxidation in CV sections of CTRL, GDM, and SGA experimental groups. (A) Statistical analysis of the following band area ratios: CH/CH3, unsaturation degree in lipid alkyl chains; CH2/CH3, length of lipid alkyl chains; 1740/AI, C=O ester moiety in lipid alkyl chains. Values are reported as mean ± SD of five independent samples (n = 5). Asterisks indicate significant differences between CTRL (blue) and GDM (purple) and CTRL and SGA (green) groups (**** = p < 0.0001). (BD) Microphotographs of representative sections of CTRL, GDM, and SGA experimental groups, and (EG) corresponding false-color images showing the topographical distribution of lipids within the mapped areas; absorbances ranged from white/pink (representing the highest values) and blue/black (representing the lowest ones).
Figure 8
Figure 8
FTIRI analysis of the carbohydrate content in CV sections of CTRL, GDM, and SGA experimental groups. (A) Statistical analysis of the CARBO/TOT band area ratio, corresponding at the amount of total carbohydrates (TOT was the sum of the areas of all the bands in the 1350–1000 cm−1 range). Values are reported as mean ± SD of five independent samples (n = 5). Asterisks indicate significant differences between CTRL (control group, blue), GDM (gestational diabetes mellitus, purple), SGA (small-for-gestational-age, green) groups (* p < 0.05). (BD) Microphotographs of representative sections of CTRL, GDM, and SGA groups, and (EG) corresponding false-color images showing the topographical distribution of carbohydrates within the mapped areas; absorbances ranged from white/pink (representing the highest values) and blue/black (representing the lowest ones).
Figure 9
Figure 9
FTIRI analysis of glycosylated compounds and phosphodiester bonds in CV sections of CTRL, GDM, and SGA experimental groups. Statistical analysis of the following band area ratio: (A) COH/TOT (representing the relative number of glycosylated compounds) and (B) COP/TOT (representing the phosphodiester bonds). Results are reported as mean ± SD of five independent samples (n = 5), and asterisks indicate significant differences between CTRL and SGA groups (* = p < 0.05 and *** = p < 0.001). CTRL: control group (blue), GDM: gestational diabetes mellitus (purple), SGA: small-for-gestational-age (green).

References

    1. Vaughan O.R., Fowden A.L. Placental metabolism: Substrate requirements and the response to stress. Reprod. Domest. Anim. 2016;51:25–35. doi: 10.1111/rda.12797. - DOI - PubMed
    1. Gude N.M., Roberts C.T., Kalionis B., King R.G. Growth and function of the normal human placenta. Thromb. Res. 2004;114:397–407. doi: 10.1016/j.thromres.2004.06.038. - DOI - PubMed
    1. Behboudi-Gandevani S., Amiri M., Bidhendi Yarandi R., Ramezani Tehrani F. The impact of diagnostic criteria for gestational diabetes on its prevalence: A systematic review and meta-analysis. Diabetol. Metab. Syndr. 2019;11:1–18. doi: 10.1186/s13098-019-0406-1. - DOI - PMC - PubMed
    1. Practice C. Diagnostic criteria and classification of hyperglycaemia first detected in pregnancy: A World Health Organization Guideline. Diabetes Res. Clin. Pract. 2014;103:341–363. doi: 10.1016/j.diabres.2013.10.012. - DOI - PubMed
    1. Alia S., Pugnaloni S., Borroni F., Mazzanti L., Giannubilo S.R., Ciavattini A., Vignini A. Impact of gestational diabetes mellitus in maternal and fetal health: An update. Diabetes Updates. 2019;5:1–6. doi: 10.15761/DU.1000129. - DOI

LinkOut - more resources