. 2023 Jan 23;24(3):2261.
doi: 10.3390/ijms24032261.

Advanced Glycation End Products Effects on Adipocyte Niche Stiffness and Cell Signaling

Affiliations

Advanced Glycation End Products Effects on Adipocyte Niche Stiffness and Cell Signaling

Roza Izgilov et al. Int J Mol Sci. .

Abstract

Adipose tissue metabolism under hyperglycemia results in Type II diabetes (T2D). To better understand how the adipocytes function, we used a cell culture that was exposed to glycation by adding intermediate carbonyl products, which caused chemical cross-linking and led to the formation of advanced glycation end products (AGEs). The AGEs increased the cells and their niche stiffness and altered the rheological viscoelastic properties of the cultured cells leading to altered cell signaling. The AGEs formed concomitant with changes in protein structure, quantified by spectroscopy using the 8-ANS and Nile red probes. The AGE effects on adipocyte differentiation were viewed by imaging and evidenced in a reduction in cellular motility and membrane dynamics. Importantly, the alteration led to reduced adipogenesis, that is also measured by qPCR for expression of adipogenic genes and cell signaling. The evidence of alteration in the plasma membrane (PM) dynamics (measured by CTxB binding and NP endocytosis), also led to the impairment of signal transduction and a decrease in AKT phosphorylation, which hindered downstream insulin signaling. The study, therefore, presents a new interpretation of how AGEs affect the cell niche, PM stiffness, and cell signaling leading to an impairment of insulin signaling.

Keywords: AGEs; adipocytes; adipogenesis; carbonyl compounds; cell migration; cytoskeleton reorganization; niche stiffness; plasma-membrane stiffness.


Conflict of interest statement

The authors declare no conflict of interest.

Figures
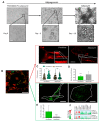
Figure 1
Figure 1
Endocytosis differences between fibroblast and adipocytes (A) Adipogenesis follow-up from fibroblast (pre-adipocyte) into adipocyte viewed by phase contrast micrograph at (×40 and ×400) magnification. Scale bar = 125 µm. (B) Immunofluorescence staining for the expression of CTxB binding (red) or NP-FITC (green) uptake was analyzed at single-cell resolution (B-E; scale bar = 20 μm). (C) CTxB intensity quantified in the cell membrane and cytoplasm of fibroblast and adipocytes. (D) The intensity of the membrane/cytoplasm ratio was compared between fibroblasts (n = 54) and adipocytes (n = 68). (E) NP–FITC internalization was measured at single cell fibroblasts (n = 16) or adipocytes (n = 18) per FOV. (F) Heat map from an MS/MS analysis for endocytosis-related proteins in fibroblasts and adipocytes in stiff/soft growing substrate conditions. (ns p > 0.05, ** p < 0.01, *** p < 0.001, **** p < 0.0001).
Figure 2
Figure 2
Cell shape, cytoskeleton, and nucleus measurement in 3D during adipogenesis. (A,B) Three dimensional confocal and Z stack micrograph of cytoskeleton’s actin staining (phalloidin-FITC) or nuclei (DAPI) (×630 magnification) on images of YZ and XZ orientation. (C,F) The measurement of cells (n = 28, fibroblast; and n = 25, adipocyte) and nuclei (n = 143, fibroblast; and n = 24, adipocyte) area. (D,G) Cells and nuclei height quantification was detected from the bottom to the top visible actin and DAPI staining (cells: n = 21, fibroblast, and n = 19, adipocytes); nuclei (n = 49 and n = 22, respectively). (E,H) Cells and nuclei volume quantification (n = 21, fibroblast; n = 19, adipocytes); nuclei (n = 48; n = 22, respectively). Data were presented as mean ± SD and statistics were analyzed by a two-tailed, unpaired Student’s t-test (ns p > 0.05, * p < 0.05, *** p < 0.001, **** p < 0.0001).
Figure 3
Figure 3
Wound healing and cell motility follow-up on live imaging. (A) Wound healing assay of fibroblast (green) and adipocytes (grey) follow-up over 48 h for % of wound area remaining to be closed (scale bar = 650 µm) (upper panel). The relative wound area for fibroblasts (n = 14) and adipocytes (n = 8) was quantified after 24 h and 48 h (lower panel). (B) Phase-contrast images; fibroblasts (black arrows, multicolor lines), and adipocytes (white arrows, multicolor dots) follow distance after 24 h. (C) Single-cell velocity of fibroblasts (n = 20) and adipocytes (n = 20) represented by a µm/min for over 24 h (left). Single-cell migration representation of a trajectory plot evaluating the accumulating distance, normalized to a common starting point (right). (D) The high-resolution images on days 0 to 6 illustrate the association between actin reorganization and cell motility (F–fibroblast, A–adipocyte) by a color map of HSB status (scale bar = 50 µm). The effect of hyperglycemic conditions on cell motility: (E) Average velocity quantification of individual cells was measured in untreated fibroblasts (n = 49, black), MGO (n = 98, green), and GAD (n = 106, red) treated cells (left). Frequency distribution of mean velocity range in treated groups (right). (F) Cumulative distance quantification displays the total cell’s distance over 5 h. Two-way ANOVA used for (A), Student’s unpaired t-test for (C), one-way ANOVA with Sidak’s multiple comparisons test (B), and Games–Howell multiple comparisons test (D); average velocity (mean ± SD). (**** p < 0.0001).
Figure 4
Figure 4
Adipogenesis under various hyperglycemic conditions, gene expressions, and stiffness changes. (A) LOA presented as a whole well stitching percentage analysis compared to GM of MGO- and GAD-treated cultures. Phase contrast representative culture images at ×40 (lower panel; scale bar = 650 µm). (B) LOA quantification analysis of MGO and GAD-treated adipocytes, compared to GM (n = 7). (C) The mRNA level of PPARγ, CEBPα, and LPL relative to actin in MGO and GAD-treated adipocytes, compared to control (GM, n = 4). One-way ANOVA ± SD. (D) Rheology measurements of GM-control (black), MGO (green), and GAD (red) measuring the G’ (solid lines) versus G” (dash lines) as a function of angular frequency sweep between 0.1–100 rad/s. (E) Time-dependent measurement of a G’ versus G” was conducted under a constant frequency over 15 min. (F) Gel point (Tan δ) measured by the loss and storage modulus ratio over time. (* p < 0.05, *** p < 0.001).
Figure 5
Figure 5
Membrane stiffness and signaling alteration in the MGO and GAD-treated cultures. (A) Confocal images of CTxB labeled cells (F–fibroblast, A–adipocyte), enlarged image highlighted with ICA LUTs to emphasize the cells’ membrane intensity (scale bar = 25 µm). (B) Quantification of membrane/cytoplasm CTxB expression ratio at the single-cell level, analyzed in fibroblasts and adipocytes (n = 40–80 cells per group). (C) The 8-ANS spectroscopy of the GM culture lysate compared to MGO and GAD-treated cells (n = 6). (D) Spectroscopy of treated adipocytes in the presence of Nile red: fluorescence spectrum with blue shift peak (right), and peak value quantification (left, n = 4). (E) Western blot analysis of phosphorylated AKT protein (pAKTser473) compared to total-AKT in GM, MGO and GAD-treated adipocytes. Results presented as mean ± SD, statistically analyzed by one-way ANOVA. (* p < 0.05, ** p < 0.01, *** p < 0.001, **** p < 0.0001).
Figure 6
Figure 6
A schematic illustration showing the mechanism of how carbonyl compound-induced hyperglycemia affects the cell’s niche stiffness through the formation of AGEs leading to changes in protein structure and functionality.

Similar articles

Cited by

References

    1. Naftaly A., Izgilov R., Omari E., Benayahu D. Revealing Advanced Glycation End Products Associated Structural Changes in Serum Albumin. ACS Biomater. Sci. Eng. 2021;7:3179–3189. doi: 10.1021/acsbiomaterials.1c00387. - DOI - PubMed
    1. Van Der Lugt T., Weseler A.R., Gebbink W.A., Vrolijk M.F., Opperhuizen A., Bast A. Dietary Advanced Glycation Endproducts Induce an Inflammatory Response in Human Macrophages In Vitro. Nutrients. 2018;10:1868. doi: 10.3390/nu10121868. - DOI - PMC - PubMed
    1. Feng Z., Du Z., Shu X., Zhu L., Wu J., Gao Q., Wang L., Chen N., Li Y., Luo M., et al. Role of RAGE in obesity-induced adipose tissue inflammation and insulin resistance. Cell Death Discov. 2021;7:305. doi: 10.1038/s41420-021-00711-w. - DOI - PMC - PubMed
    1. Briceno Noriega D., Zenker H.E., Croes C.A., Ewaz A., Ruinemans-Koerts J., Savelkoul H.F.J., van Neerven R.J.J., Teodorowicz M. Receptor Mediated Effects of Advanced Glycation End Products (AGEs) on Innate and Adaptative Immunity: Relevance for Food Allergy. Nutrients. 2022;14:371. doi: 10.3390/nu14020371. - DOI - PMC - PubMed
    1. Spampinato S.F., Caruso G.I., De Pasquale R., Sortino M.A., Merlo S. The Treatment of Impaired Wound Healing in Diabetes: Looking among Old Drugs. Pharmaceuticals. 2020;13:60. doi: 10.3390/ph13040060. - DOI - PMC - PubMed

MeSH terms

Substances