. 2023 Jan 24;24(3):2293.
doi: 10.3390/ijms24032293.

The Gold(I) Complex with Plant Hormone Kinetin Shows Promising In Vitro Anticancer and PPARγ Properties

Affiliations

The Gold(I) Complex with Plant Hormone Kinetin Shows Promising In Vitro Anticancer and PPARγ Properties

Zdeněk Trávníček et al. Int J Mol Sci. .

Abstract

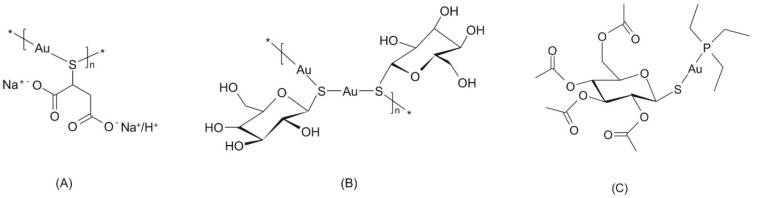
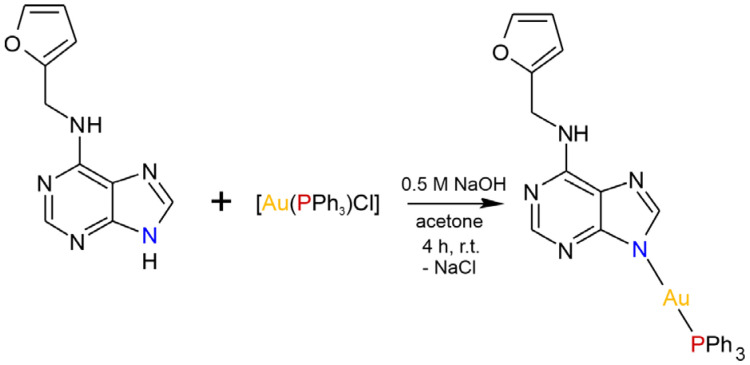
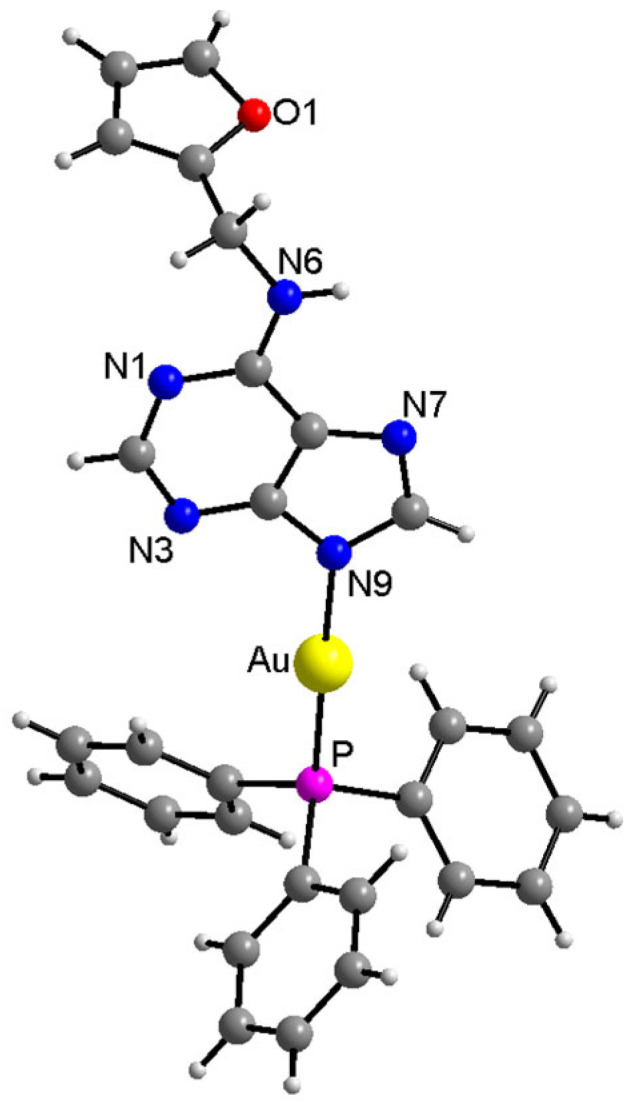
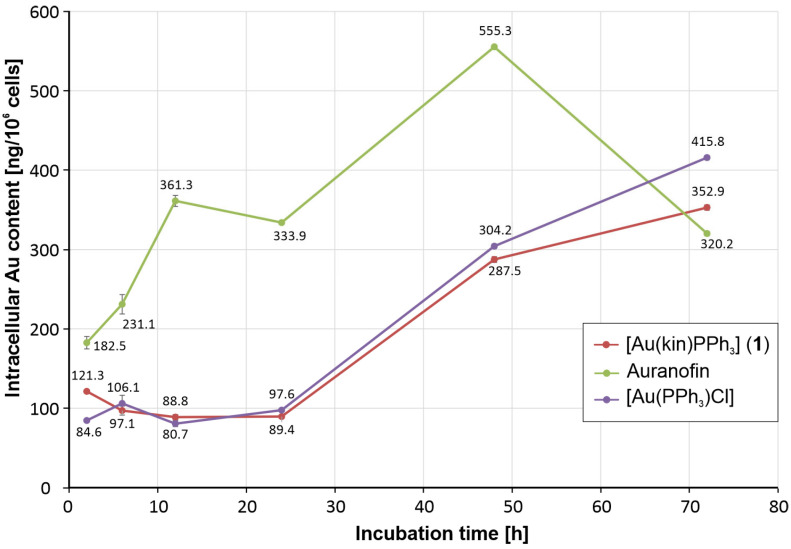
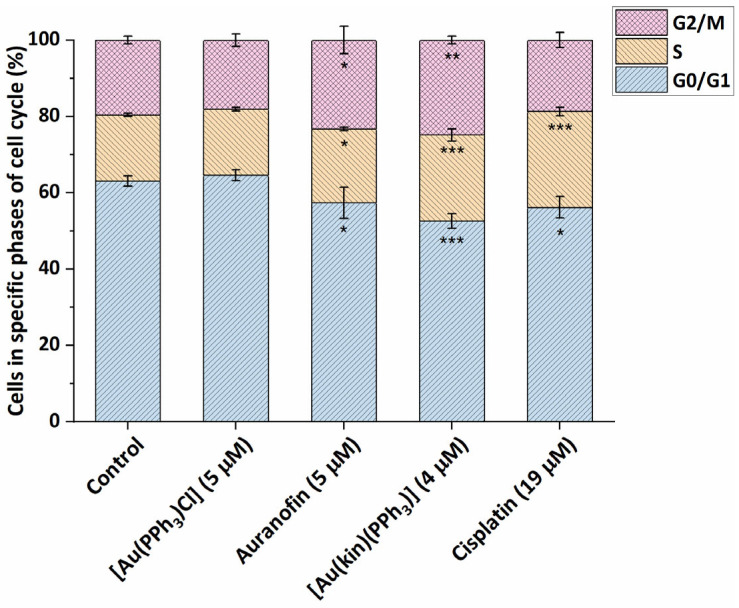
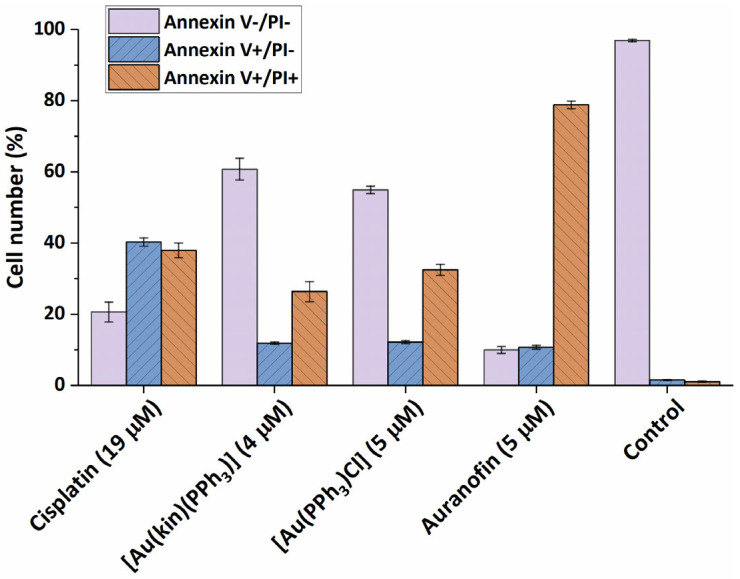
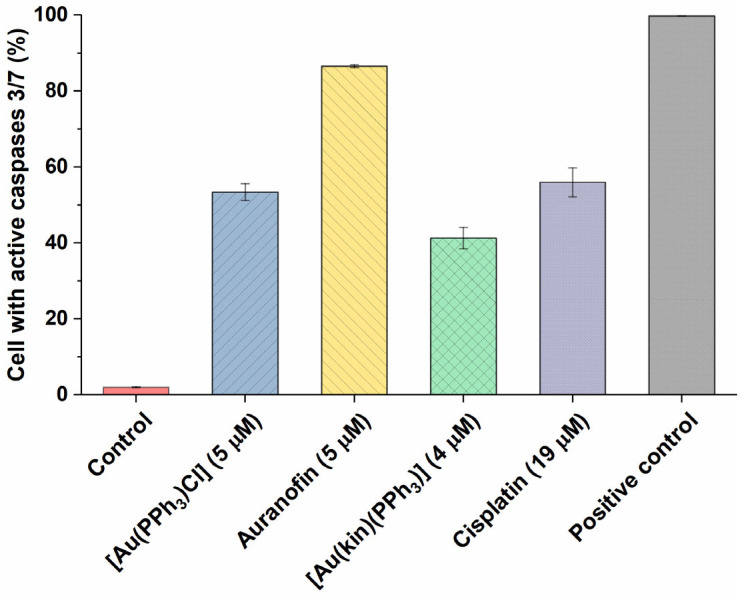
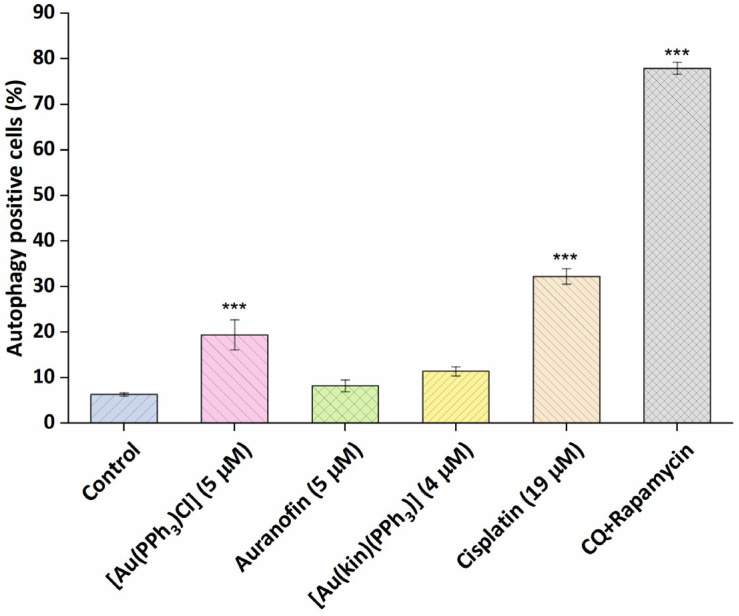
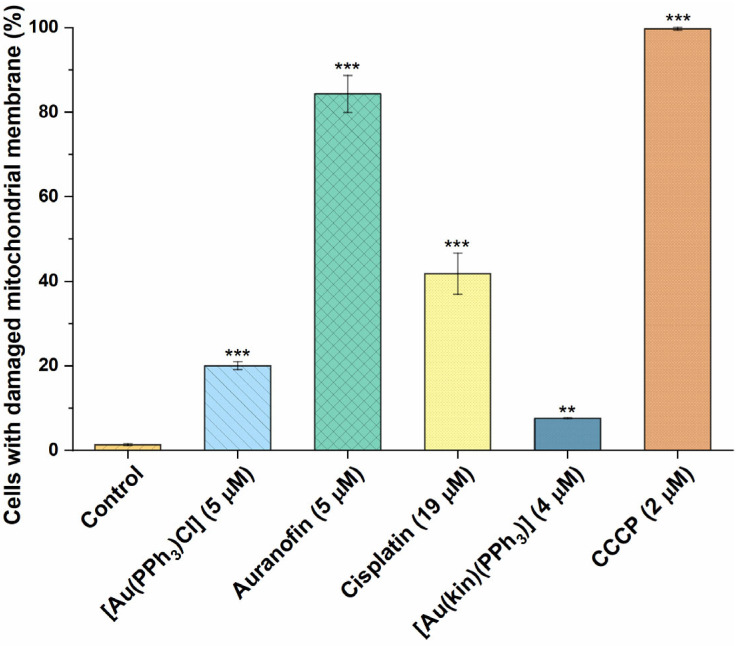
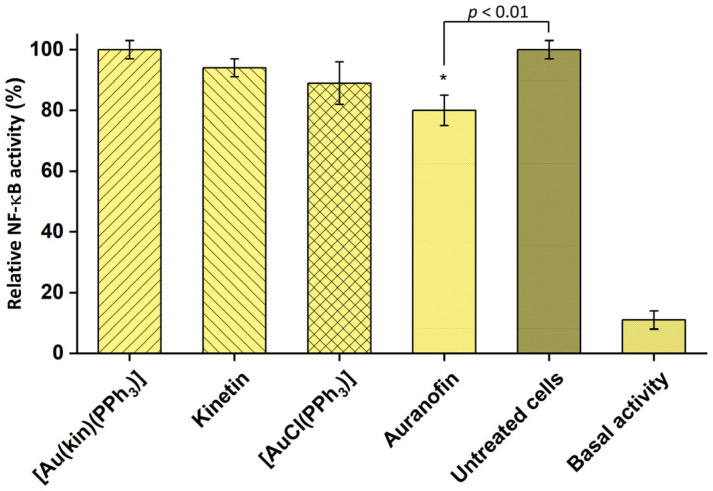
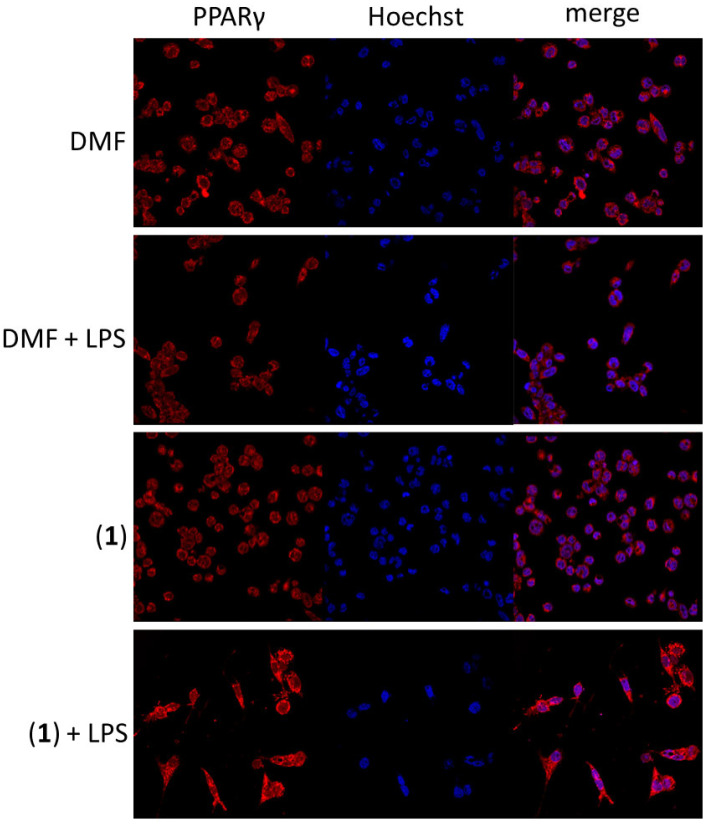
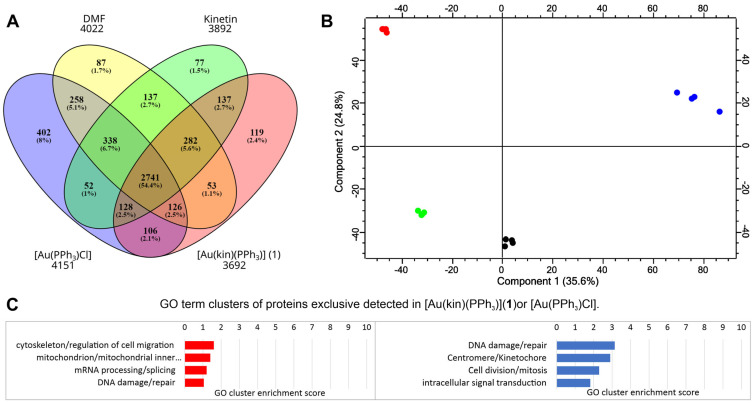
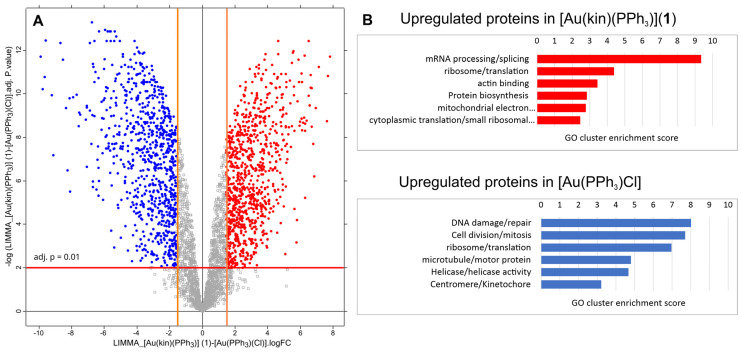
Motivated by the clinical success of gold(I) metallotherapeutic Auranofin in the effective treatment of both inflammatory and cancer diseases, we decided to prepare, characterize, and further study the [Au(kin)(PPh3)] complex (1), where Hkin = kinetin, 6-furfuryladenine, for its in vitro anti-cancer and anti-inflammatory activities. The results revealed that the complex (1) had significant in vitro cytotoxicity against human cancer cell lines (A2780, A2780R, PC-3, 22Rv1, and THP-1), with IC50 ≈ 1-5 μM, which was even significantly better than that for the conventional platinum-based drug Cisplatin while comparable with Auranofin. Although its ability to inhibit transcription factor NF-κB activity did not exceed the comparative drug Auranofin, it has been found that it is able to positively influence peroxisome-proliferator-activated receptor-gamma (PPARγ), and as a consequence of this to have the impact of moderating/reducing inflammation. The cellular effects of the complex (1) in A2780 cancer cells were also investigated by cell cycle analysis, induction of apoptosis, intracellular ROS production, activation of caspases 3/7 and disruption of mitochondrial membrane potential, and shotgun proteomic analysis. Proteomic analysis of R2780 cells treated with complex (1) and starting compounds revealed possible different places of the effect of the studied compounds. Moreover, the time-dependent cellular accumulation of copper was studied by means of the mass spectrometry study with the aim of exploring the possible mechanisms responsible for its biological effects.

Keywords: PPAR; ROS; anti-inflammatory; anticancer; apoptosis; cell cycle; gold(I) complex; in vitro; kinetin.


Conflict of interest statement

The authors declare no conflict of interest.

Figures

Figure 1
Figure 1
The structural formulas of three major gold-containing pharmacotherapeutics: natrium-aurothiomalate (A), aurothioglucose (B) and Auranofin (C). The asterisk symbols (*) mark the sites where the head-to-tail coupling of the monomeric units to the polymeric chain occurs.
Scheme 1
Scheme 1
The reaction pathway leading to [Au(kin)(PPh3)] (1).
Figure 2
Figure 2
X-ray structure of [Au(kin)(PPh3)] (1). The labelling of the carbon (dark grey) and hydrogen (light grey) atoms is omitted for better clarity. The molecular graphics were generated in Diamond software (Crystal Impact, Bonn, Germany).
Figure 3
Figure 3
The intracellular gold concentration levels caused by the incubation of [Au(kin)(PPh3)] (1), [Au(PPh3)Cl], and Auranofin with A2780 cells after 2 h, 6 h, 12 h, 24 h, 48 h, and 72 h. The results were obtained by ICP-MS analyses of three parallel samples and are shown as mean values with error bars corresponding to the standard deviation values of the gold concentration expressed in ng of gold per 106 cells.
Figure 4
Figure 4
Modifications of the cell cycle of A2780 cells caused by the 24 h incubation of (1), starting complex [Au(PPh3)Cl], and reference drugs Auranofin and Cisplatin, applied at half-cytotoxic concentration levels. The statistical significance was considered at the following levels: * p < 0.05, ** p < 0.01, *** p < 0.001 with respect to the untreated control group.
Figure 5
Figure 5
The ability of (1) and the reference gold(I) complexes [Au(PPh3)Cl], Auranofin, and a reference drug Cisplatin to cause the transformation of intact A2780 cells (Annexin V-/PI-) towards early apoptosis (Annexin V+/PI-) and late-stage apoptosis (Annexin V+/PI+) after 24 h of incubation with half-cytotoxic concentrations of the compounds. The changes in all groups were found to be significant at the p < 0.0001 level with respect to the untreated control group.
Figure 6
Figure 6
The ability of (1) and the reference gold(I) complexes [Au(PPh3)Cl], Auranofin, and a reference drug Cisplatin to activate the executioner caspases 3/7 in A2780 cells after 24 h of incubation with half-cytotoxic concentrations of the compounds. The changes in all groups were found to be significant at the p < 0.0001 level with respect to the untreated control group. The positive control represents the untreated cells heated to 60 °C for 10 min.
Figure 7
Figure 7
The effectiveness of (1), the starting complex [Au(PPh3)Cl], and the reference drugs Auranofin and Cisplatin to induce autophagy of A2780 cells after 24 h of incubation with half-cytotoxic concentrations of the compounds. The statistical significance was considered at the *** p < 0.001 level with respect to the untreated control group. The positive control represents the cells treated with the mixture of chloroquine and rapamycin (CQ + rapamycin), a known strong inducer of autophagy.
Figure 8
Figure 8
The demonstration of damage to mitochondrial membranes in A2780 cells after 24 h of incubation with half-cytotoxic concentrations caused by (1), the starting complex [Au(PPh3)Cl], and the reference drugs Auranofin and Cisplatin. The statistical significance was considered at the following levels: ** p < 0.01, *** p < 0.001 with respect to the untreated control group. The positive control represents the cells treated with carbonyl cyanide chlorophenylhydrazone (CCCP), a well-documented agent causing the mitochondrial function disruption.
Figure 9
Figure 9
Effect of the tested compounds on NF-κB activity in THP1-Blue™ NF-κB monocytes. Effect of 1 h pre-treatment on LPS-stimulated NF-κB activity detected after 24 h. The statistical significance was considered at the * p < 0.01 level as compared to the vehicle (DMF) group. Data are shown as means ± SEM.
Figure 10
Figure 10
The effect of (1) on the amount and intracellular localization of PPARγ in THP1-Blue™ NF-κB macrophages after 1 h pre-treatment. The visual data were collected using a Leica TCS SP8 MP confocal microscope (Leica Microsystems, Mannheim, Germany).
Figure 11
Figure 11
The summary of proteomic results of the R2780 cells treated with the gold complexes [Au(kin)(PPh3)] (1) and [Au(PPh3)Cl], and reference samples kinetin and dimethylformamide (DMF). (A) An overview of the results of all four samples. The numbers below the samples’ labels represent the total number of identified proteins for each compound. (B) The PCA plot of the analyzed samples. Red color belongs to [Au(kin)(PPh3)] (1), blue color to [Au(PPh3)Cl], green color to the reference sample kinetin, and black color to the reference sample DMF. (C) A summary of the bioinformatic analysis of the enrichment of GO terms of the protein exclusively identified in the sample treated with the gold complexes. The red chart represents the sample treated with [Au(kin)(PPh3)] (1), and the blue chart represents the sample treated with [Au(PPh3)Cl]. Four technical replicates represent each biological sample. A Venn diagram was created by the tool Oliveros, J.C. (2007–2015) Venny, an interactive tool for comparing lists with Venn diagrams: https://bioinfogp.cnb.csic.es/tools/venny/index.html (accessed on 28 April 2022). The PCA plot was created by the Perseus tool v. 2.0.7.0.
Figure 12
Figure 12
(A) The volcano plot of differences at protein levels between samples treated with [Au(kin)(PPh3)] (1) versus [Au(PPh3)Cl]. The lines in the chart define the stringency of detecting upregulated proteins. The red line represents the adj. p-value at 0.01. The orange lines define the minimal limits of protein fold-change to be taken as upregulated. They were set to log2(FC) equal to 1.58, which states that the change of the protein level between differentially treated samples must be at least three times higher. Red dots represent the proteins upregulated in the sample treated with the complex [Au(kin)(PPh3)] (1). Conversely, the blue dots represent the proteins upregulated in the sample treated with the complex [Au(PPh3)Cl]. (B) Summary of the enrichment of GO terms for upregulated proteins in each sample. The volcano plot was created by the Perseus tool v. 2.0.7.0.

References

    1. Chaffman M., Brogden R.N., Heel R.C., Speight T.M., Avery G.S. Auranofin: A preliminary review of its pharmacological properties and therapeutic use in rheumatoid arthritis. Drugs. 1984;27:378–424. doi: 10.2165/00003495-198427050-00002. - DOI - PubMed
    1. Gamberi T., Chiappetta G., Fiaschi T., Modesti A., Sorbi F., Magheriniet F. Upgrade of an old drug: Auranofin in innovative cancer therapies to overcome drug resistance and to increase drug effectiveness. Med. Chem. Rev. 2020;42:1111–1146. doi: 10.1002/med.21872. - DOI - PMC - PubMed
    1. Marzo T., Cirri D., Gabbiani C., Gamberi T., Magherini F., Pratesi A., Guerri A., Biver T., Binacchi F., Stefanini M., et al. Auranofin, Et3PAuCl, and Et3PAuI Are Highly Cytotoxic on Colorectal Cancer Cells: A Chemical and Biological Study. ACS Med. Chem. Lett. 2017;8:997–1001. doi: 10.1021/acsmedchemlett.7b00162. - DOI - PMC - PubMed
    1. Abdalbari F.H., Telleria C.M. The gold complex auranofin: New perspectives for cancer therapy. Discov. Oncol. 2021;12:42. doi: 10.1007/s12672-021-00439-0. - DOI - PMC - PubMed
    1. Marzo T., Cirri D., Pollini S., Prato M., Fallani S., Cassetta M.I., Novelli A., Rossolini G.M., Messori L. Auranofin and its Analogues Show Potent Antimicrobial Activity against Multidrug-Resistant Pathogens: Structure–Activity Relationships. ChemMedChem. 2018;13:2448–2454. doi: 10.1002/cmdc.201800498. - DOI - PubMed