. 2023 Jan 30;24(3):2588.
doi: 10.3390/ijms24032588.

A Mixture of Chemicals Found in Human Amniotic Fluid Disrupts Brain Gene Expression and Behavior in Xenopus laevis

Affiliations

A Mixture of Chemicals Found in Human Amniotic Fluid Disrupts Brain Gene Expression and Behavior in Xenopus laevis

Michelle Leemans et al. Int J Mol Sci. .

Abstract

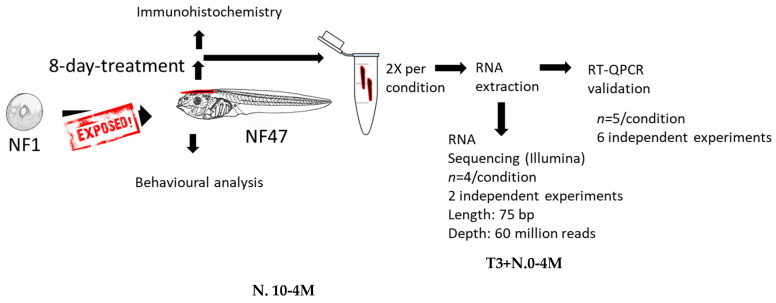
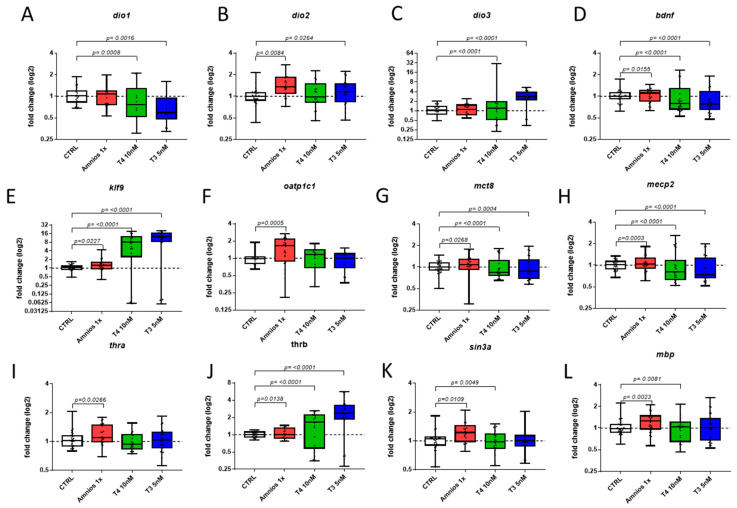
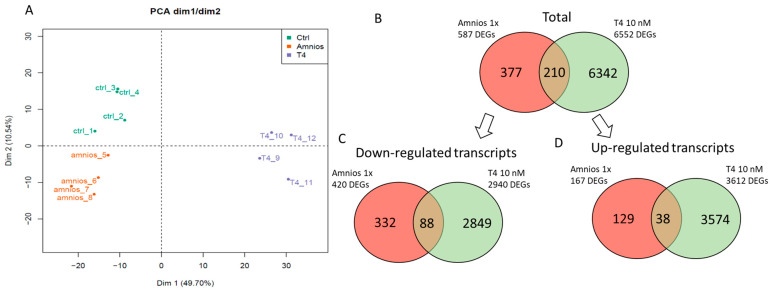
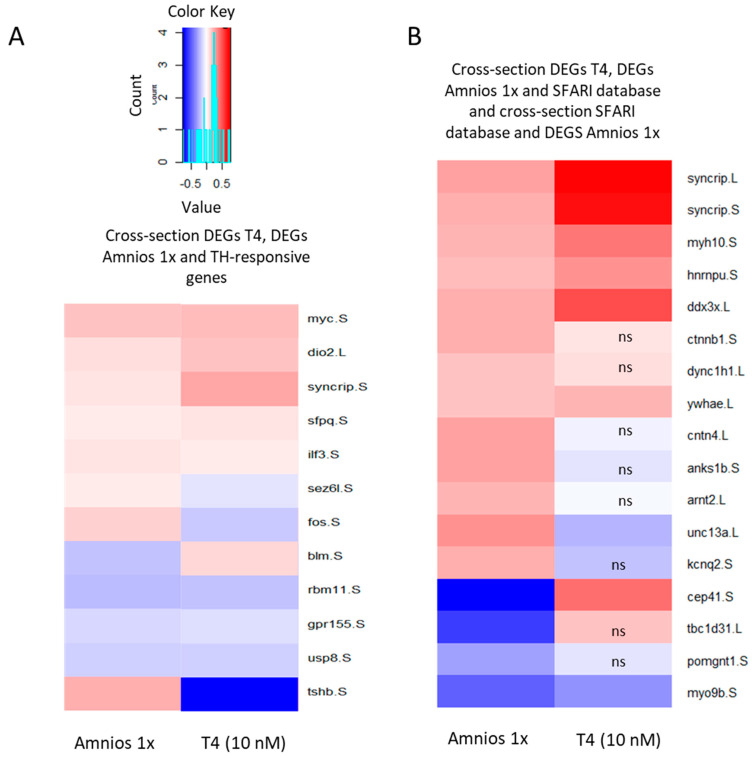
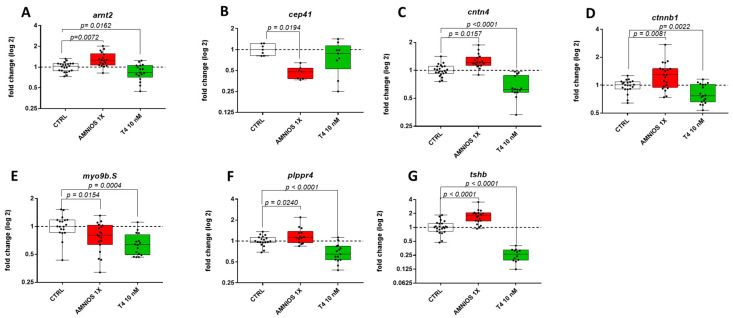
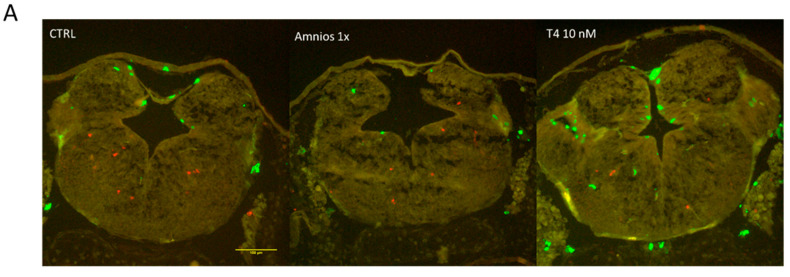
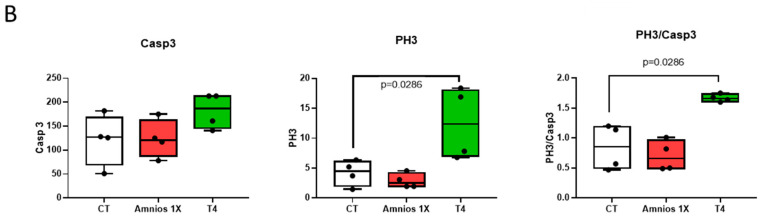
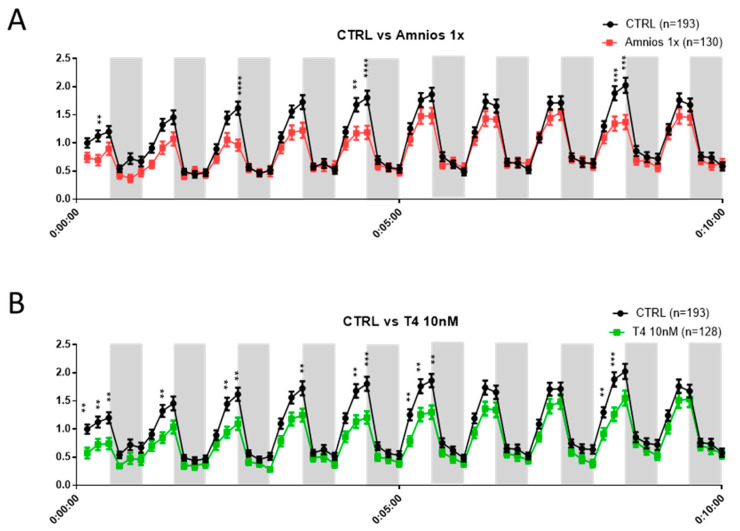
Thyroid hormones (TH) are essential for normal brain development, influencing neural cell differentiation, migration, and synaptogenesis. Multiple endocrine-disrupting chemicals (EDCs) are found in the environment, raising concern for their potential effects on TH signaling and the consequences on neurodevelopment and behavior. While most research on EDCs investigates the effects of individual chemicals, human health may be adversely affected by a mixture of chemicals. The potential consequences of EDC exposure on human health are far-reaching and include problems with immune function, reproductive health, and neurological development. We hypothesized that embryonic exposure to a mixture of chemicals (containing phenols, phthalates, pesticides, heavy metals, and perfluorinated, polychlorinated, and polybrominated compounds) identified as commonly found in the human amniotic fluid could lead to altered brain development. We assessed its effect on TH signaling and neurodevelopment in an amphibian model (Xenopus laevis) highly sensitive to thyroid disruption. Fertilized eggs were exposed for eight days to either TH (thyroxine, T4 10 nM) or the amniotic mixture (at the actual concentration) until reaching stage NF47, where we analyzed gene expression in the brains of exposed tadpoles using both RT-qPCR and RNA sequencing. The results indicate that whilst some overlap on TH-dependent genes exists, T4 and the mixture have different gene signatures. Immunohistochemistry showed increased proliferation in the brains of T4-treated animals, whereas no difference was observed for the amniotic mixture. Further, we demonstrated diminished tadpoles' motility in response to T4 and mixture exposure. As the individual chemicals composing the mixture are considered safe, these results highlight the importance of examining the effects of mixtures to improve risk assessment.

Keywords: Xenopus laevis; endocrine disruption; neurodevelopment; thyroid hormones.


Conflict of interest statement

The authors declare no conflict of interest.

Figures

Figure 1
Figure 1
Schematic representation of the conducted exposure study. Fifteen X. laevis tadpoles per group were exposed for 8 days starting just after fertilization (NF 1) to stage NF 47 before gene expression analysis, mobility assays, and brain immunohistochemistry.
Figure 2
Figure 2
Gene expression after embryonic exposure to the amniotic mixture and THs. Embryos (NF 1–NF 47) were exposed to DMSO (CTRL), amniotic mixture at 1x concentration (Amnios 1X), T4 (10 nanomolar), and T3 (5 nanomolar). After brain dissection at stage NF 47, RNA extraction and RT-qPCR were conducted on genes involved in the TH signaling pathway, (A) dio1, (B) dio2, (C) dio3, (E) klf9, (F) oatp1c1, (G) mct8, (I) thra, (J) thrb, and brain development, (D) bdnf, (H) mecp2, (K) sin3a, and (L) mbp. Results are normalized to the geometric mean of the expression levels of the genes ube2m and ralb. Results are a pool of 6 independent replicates with n = 5 by group by replicate. The line in each box represents the median.
Figure 3
Figure 3
Principal component analysis plot of gene expression profiles from brain samples of exposed Xenopus tadpoles and Venn diagram from differentially expressed transcripts. (A) The profiles from the amniotic mixture (amnios (n = 4)) cluster separately to clusters representative of T4 (T4 10 nM (n = 4)) or control exposures (control (n = 4)). (B) Venn diagram showing the differentially expressed genes in each group compared to the control. (C) Venn diagrams showing either down- or (D) up-regulated genes compared to the controls.
Figure 4
Figure 4
Changes in expression levels of genes specifically affected by amniotic mixture or T4 treatment. Heatmap depicts the average change in the expression level of genes affected by either amniotic mixture (Amnios 1X) or T4 (10 nM). Gene names are shown at the right of the heatmap. The color bar represents log2 differences from the control for each treatment. (A) DEGs that are in common between T4 and amniotic treatment as well as TH-responsive genes [22]. (B) DEGs that are common between either amniotic mixture and SFARI gene list and DEGs in common between Amnios 1X, T4 (10 nM), and SFARI gene list. The letters ns stand for non-significant; these genes do not belong to the DEG list.
Figure 5
Figure 5
Gene expression after embryonic exposure to the amniotic mixture and THs. Embryos (NF 1–NF 47) were exposed to DMSO (CTRL), amniotic mixture at 1x concentration (Amnios 1X), and T4 (10 nanomolar). After brain dissection at stage NF 47, RNA extraction and RT-qPCR were conducted on genes involved in TH signaling or autism-related genes, (A) arnt2, (B) cep41, (C) cntn4, (D) ctnnb1, (E) myo9b, (F) plppr4, (G) tshb. 2.1. Exposure to TH but Not Amniotic Mixture Induces Both Apoptosis and Proliferation.
Figure 6
Figure 6
Effect of Amnios 1X and T4 on proliferation and apoptosis in tadpole brains. For each treatment group, 2 tadpoles from 3 different females were analyzed. (A) Example cross-sectional images of brains following immunochemistry: apoptosis marker in red (caspase3), proliferation marker in green (PH3). Scale bar, 100 µm. (B) Average number of positive cell nuclei per section for caspase3 and PH3, and the ratio of proliferative/apoptotic cells.
Figure 6
Figure 6
Effect of Amnios 1X and T4 on proliferation and apoptosis in tadpole brains. For each treatment group, 2 tadpoles from 3 different females were analyzed. (A) Example cross-sectional images of brains following immunochemistry: apoptosis marker in red (caspase3), proliferation marker in green (PH3). Scale bar, 100 µm. (B) Average number of positive cell nuclei per section for caspase3 and PH3, and the ratio of proliferative/apoptotic cells.
Figure 7
Figure 7
Behavioral study of tadpoles exposed to amniotic mixture and T4 (10 nM). The normalized distance was measured during 10 min trials with 30 s light/30 s dark alternation using Video tracking Noldus Ethovision system. NF 47 tadpoles, directly after 8-day exposure to either (A) the amniotic mixture or (B) T4 (10 nM), were used to investigate traveled distance. Graph: mean +/− SEM, multiple t-tests with FDR approach, FDR (Q) = 5%, ** p < 0.01, *** p < 0.001, and **** p < 0.0001. For each exposure, 3 technical replicates were conducted. These replicates were pooled, and each replicate contains between 37 and 48 tadpoles per condition. The total amount of tadpoles used can be found within the figure legend.

Similar articles

Cited by

References

    1. Railton T.C. Sporadic Cretinism Treated by Administration of the Thyroid Gland. Br. Med. J. 1894;1:1180–1181. doi: 10.1136/bmj.1.1744.1180. - DOI - PMC - PubMed
    1. Smith T. Case of sporadic cretinism treated with thyroid gland. Br. Med. J. 1894;1:1178–1180. doi: 10.1136/bmj.1.1744.1178. - DOI - PMC - PubMed
    1. Bernal J. Thyroid hormone receptors in brain development and function. Nat. Clin. Pract. Endocrinol. Metab. 2007;3:249–259. doi: 10.1038/ncpendmet0424. - DOI - PubMed
    1. Nunez J., Celi F.S., Ng L., Forrest D. Multigenic control of thyroid hormone functions in the nervous system. Mol. Cell. Endocrinol. 2008;287:1–12. doi: 10.1016/j.mce.2008.03.006. - DOI - PMC - PubMed
    1. Pharoah P.O., Ellis S.M., Ekins R.P., Williams E.S. Maternal thyroid function, iodine deficiency and fetal development. Clin. Endocrinol. 1976;5:159–166. doi: 10.1111/j.1365-2265.1976.tb02827.x. - DOI - PubMed