. 2023 Jan 30;24(3):2595.
doi: 10.3390/ijms24032595.

MetaSEM: Gene Regulatory Network Inference from Single-Cell RNA Data by Meta-Learning

Affiliations

MetaSEM: Gene Regulatory Network Inference from Single-Cell RNA Data by Meta-Learning

Yongqing Zhang et al. Int J Mol Sci. .

Abstract

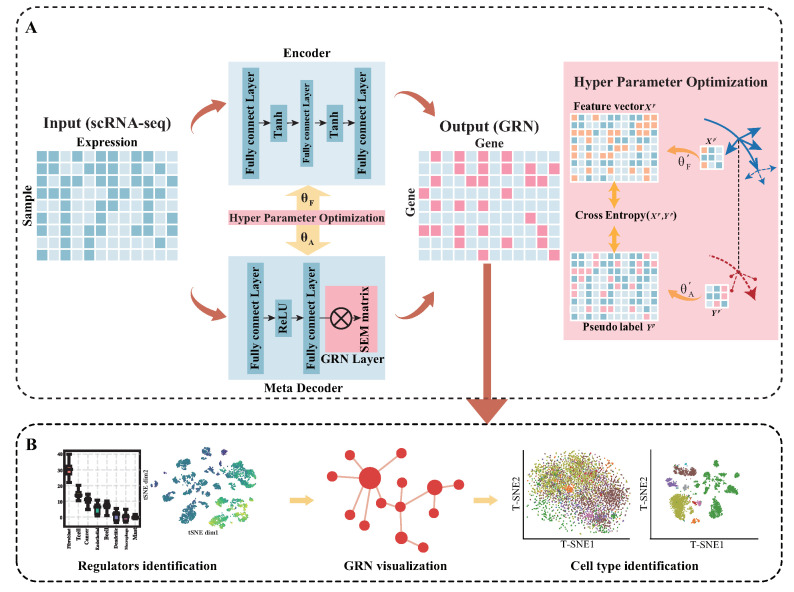
Regulators in gene regulatory networks (GRNs) are crucial for identifying cell states. However, GRN inference based on scRNA-seq data has several problems, including high dimensionality and sparsity, and requires more label data. Therefore, we propose a meta-learning GRN inference framework to identify regulatory factors. Specifically, meta-learning solves the parameter optimization problem caused by high-dimensional sparse data features. In addition, a few-shot solution was used to solve the problem of lack of label data. A structural equation model (SEM) was embedded in the model to identify important regulators. We integrated the parameter optimization strategy into the bi-level optimization to extract the feature consistent with GRN reasoning. This unique design makes our model robust to small-scale data. By studying the GRN inference task, we confirmed that the selected regulators were closely related to gene expression specificity. We further analyzed the GRN inferred to find the important regulators in cell type identification. Extensive experimental results showed that our model effectively captured the regulator in single-cell GRN inference. Finally, the visualization results verified the importance of the selected regulators for cell type recognition.

Keywords: bi-level optimization; gene regulator network inference; meta-learning; structural equation model.


Conflict of interest statement

The authors declare no conflict of interest.

Figures

Figure 1
Figure 1
(A) The overview of MetaSEM: the meta-decoder extracts the regulatory relationship to output a pseudo-data label. The encoder transforms the data feature into feature vectors. The GRN Layer is a specially designed layer for embedding the SEM matrix. The red arrows indicate the outer loop, and the yellow arrows indicate the inner loop. With hyperparameter optimization, MetaSEM integrates the outer and inner loop based on gradient. The θF represents the hyperparameters of the encoder, and θA represents the hyperparameters of the meta-decoder. (B) By analyzing the SEM matrix, MetaSEM performs three major functions: identification of the regulators, GRN visualization, and cell-type identification.
Figure 2
Figure 2
The robustness of our model on different data scales. Each column corresponds to a cell’s sub-dataset (left: mHSC-L, middle: mHSC-GM, and right: mHSC-E), and each row corresponds to an evaluation index (top: EPR, middle: AUPR, and bottom: AUROC). The red region of the figure is the result of standard deviation selection, and the blue region of the figure is the result of random selection. Pretraining and fine-tuning were not conducted for each test.
Figure 3
Figure 3
The Pearson correlation of different cell-type GRNs. Each element in the matrix represents the Pearson correlation of the GRN corresponding to two different cells. We do not show the results with a p-value greater than 0.05.
Figure 4
Figure 4
The divergence of gene expression on different cell types. The red dot represents the genes with a positive correlation, the blue dot represents the genes with a negative correlation, and the black dot represents the gene with no difference in expression level. The grey dot represents the gene below the threshold.
Figure 5
Figure 5
The regulatory weight of the different genes in the eight cells. Four regulators are presented: ATF4, JUN, RPL7A, and RPS4X. The boxplots show the weight distribution of the regulators on different SEM matrices. The t-SNE plots represent the weight distribution of regulators on the datasets.
Figure 6
Figure 6
Visualization of the GRN inference by MetaSEM on Cancer and Fibroblast datasets. The size of nodes indicates the regulatory weight. The blue edges are the main part of GRN, indicating the common regulatory relationship between the two cells. Green and red regulatory relationships only exist in Cancer GRNs or Fibroblast GRNs.
Figure 7
Figure 7
Visualization of selected regulators with different regulatory weights. Each row represents a clustering method (top row: Louvain, bottom row: Leiden). Each column represents the regulatory weight of the selected data by ascending ranking. The dimension reduction method of the graph is TSNE.

References

    1. Wouters J., Atak Z.K., Aerts S. Decoding transcriptional states in cancer. Curr. Opin. Genet. Dev. 2017;43:82–92. doi: 10.1016/j.gde.2017.01.003. - DOI - PubMed
    1. Chan T.E., Stumpf M.P., Babtie A.C. Gene regulatory network inference from single-cell data using multivariate information measures. Cell Syst. 2017;5:251–267. doi: 10.1016/j.cels.2017.08.014. - DOI - PMC - PubMed
    1. Fiers M.W., Minnoye L., Aibar S., Bravo González-Blas C., Kalender Atak Z., Aerts S. Mapping gene regulatory networks from single-cell omics data. Briefings Funct. Genom. 2018;17:246–254. doi: 10.1093/bfgp/elx046. - DOI - PMC - PubMed
    1. Wu Y., Zhang K. Tools for the analysis of high-dimensional single-cell RNA sequencing data. Nat. Rev. Nephrol. 2020;16:408–421. doi: 10.1038/s41581-020-0262-0. - DOI - PubMed
    1. Chen G., Ning B., Shi T. Single-cell RNA-seq technologies and related computational data analysis. Front. Genet. 2019:317. doi: 10.3389/fgene.2019.00317. - DOI - PMC - PubMed

LinkOut - more resources