

Deciphering the Kidney Matrisome: Identification and Quantification of Renal Extracellular Matrix Proteins in Healthy Mice
- PMID: 36769148
- PMCID: PMC9917693
- DOI: 10.3390/ijms24032827
Deciphering the Kidney Matrisome: Identification and Quantification of Renal Extracellular Matrix Proteins in Healthy Mice
Abstract
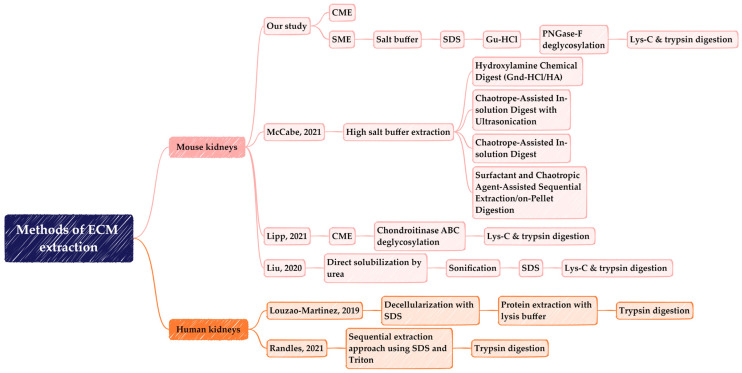
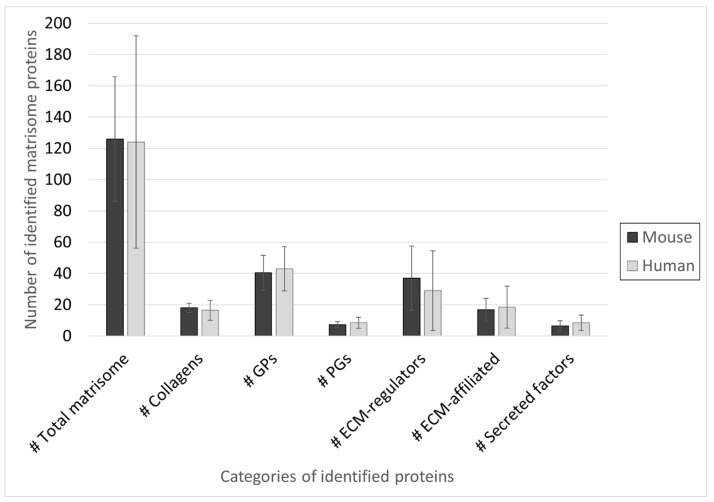
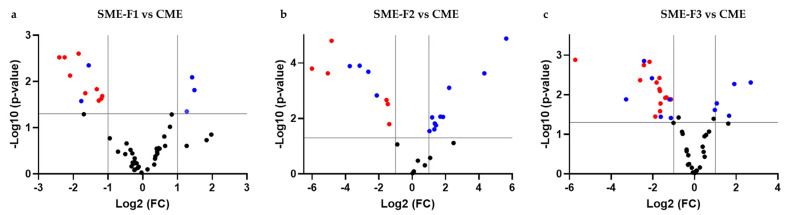
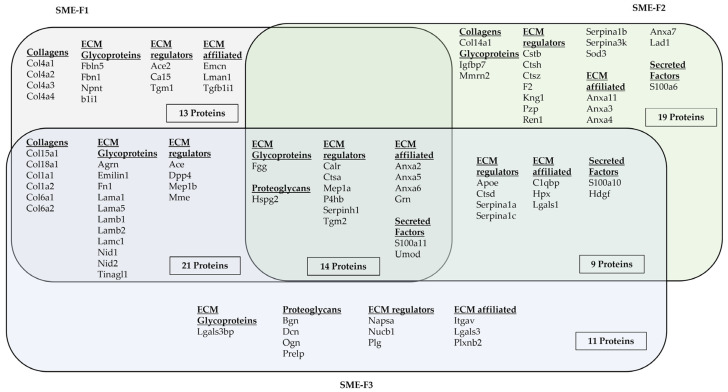
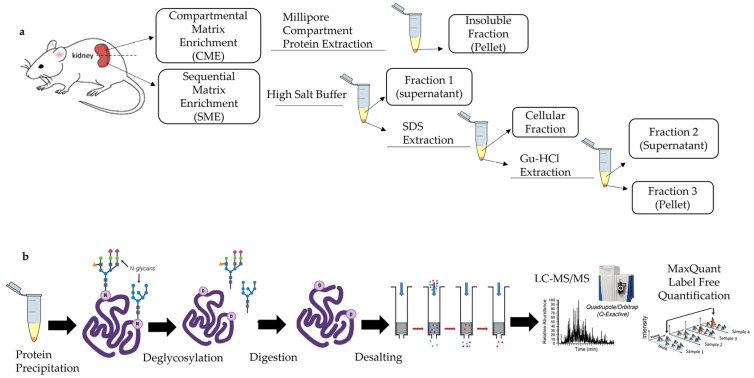
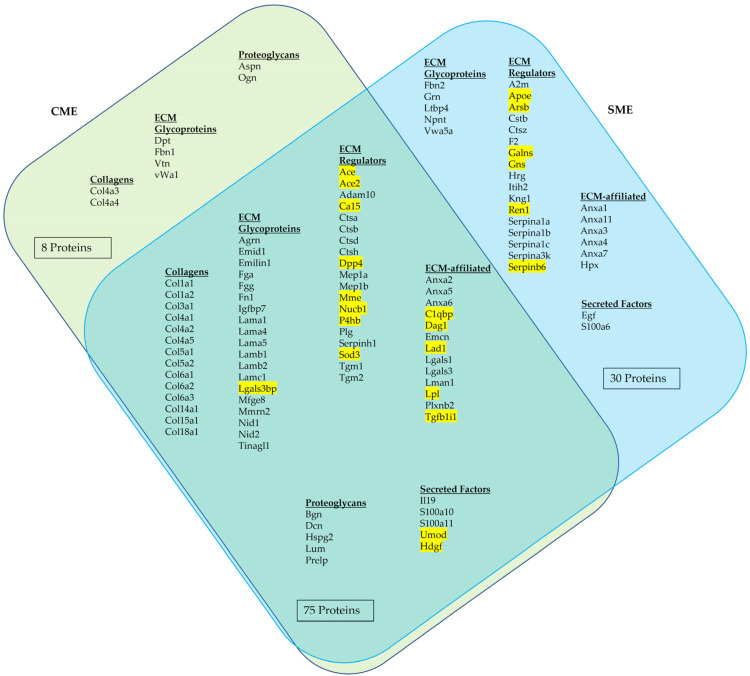
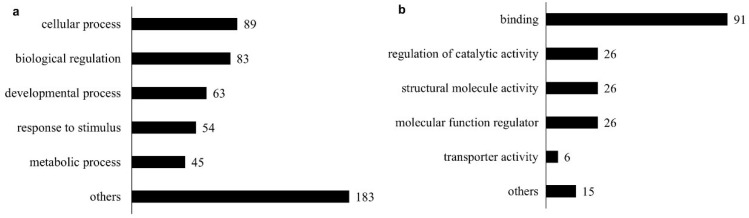
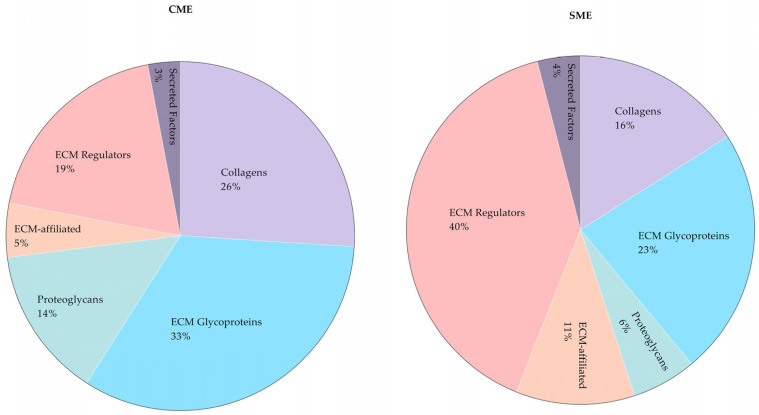
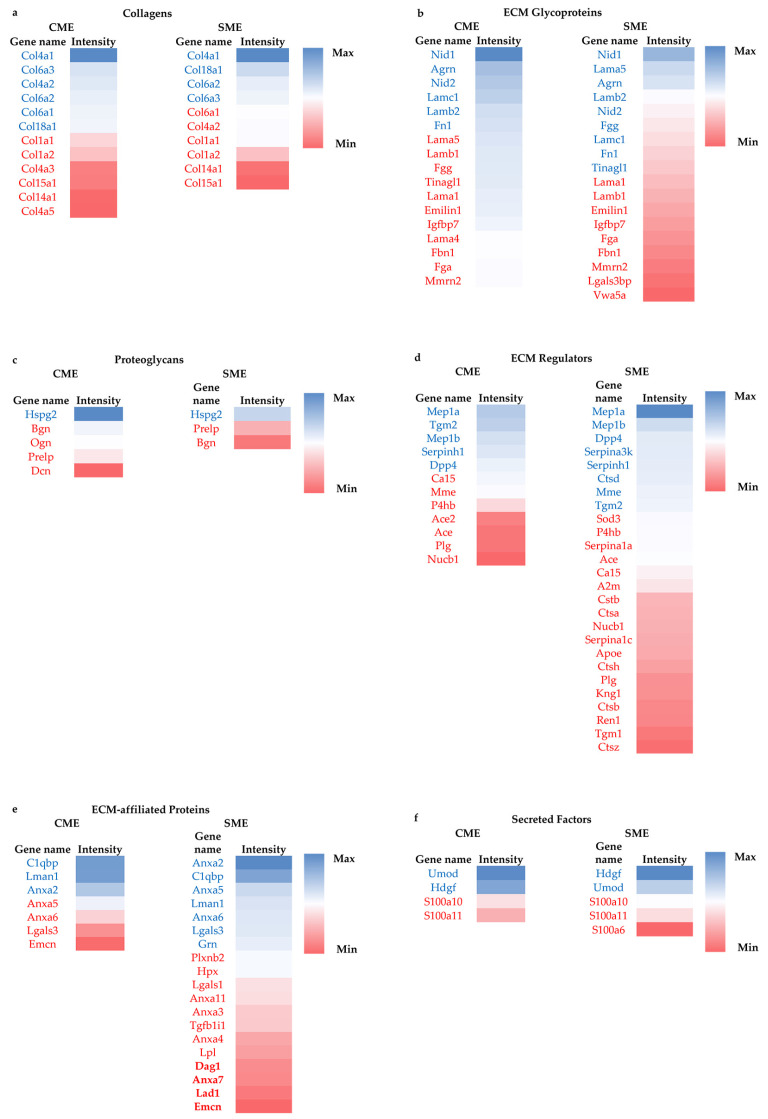
Precise characterization of a tissue's extracellular matrix (ECM) protein composition (matrisome) is essential for biomedicine. However, ECM protein extraction that requires organ-specific optimization is still a major limiting factor in matrisome studies. In particular, the matrisome of mouse kidneys is still understudied, despite mouse models being crucial for renal research. Here, we comprehensively characterized the matrisome of kidneys in healthy C57BL/6 mice using two ECM extraction methods in combination with liquid chromatography tandem mass spectrometry (LC-MS/MS), protein identification, and label-free quantification (LFQ) using MaxQuant. We identified 113 matrisome proteins, including 22 proteins that have not been previously listed in the Matrisome Database. Depending on the extraction approach, the core matrisome (structural proteins) comprised 45% or 73% of kidney ECM proteins, and was dominated by glycoproteins, followed by collagens and proteoglycans. Among matrisome-associated proteins, ECM regulators had the highest LFQ intensities, followed by ECM-affiliated proteins and secreted factors. The identified kidney ECM proteins were primarily involved in cellular, developmental and metabolic processes, as well as in molecular binding and regulation of catalytic and structural molecules' activity. We also performed in silico comparative analysis of the kidney matrisome composition in humans and mice based on publicly available data. These results contribute to the first reference database for the mouse renal matrisome.
Keywords: extracellular matrix; kidneys; label-free quantification (LFQ) of proteins; mass spectrometry; matrisome; mouse; protein identification; proteomics; tissue extraction.
Conflict of interest statement
The authors declare no conflict of interest. The funders had no role in the design of the study; in the collection, analyses, or interpretation of data; in the writing of the manuscript; or in the decision to publish the results.
Figures
Similar articles
-
Benefits and limits of decellularization on mass-spectrometry-based extracellular matrix proteome analysis of mouse kidney.Proteomics. 2024 Sep;24(17):e2400052. doi: 10.1002/pmic.202400052. Epub 2024 Jun 19. Proteomics. 2024. PMID: 38896836
-
SWATH mass spectrometry as a tool for quantitative profiling of the matrisome.J Proteomics. 2018 Oct 30;189:11-22. doi: 10.1016/j.jprot.2018.02.026. Epub 2018 Mar 1. J Proteomics. 2018. PMID: 29501709 Free PMC article.
-
Comparison of extracellular matrix enrichment protocols for the improved characterization of the skin matrisome by mass spectrometry.J Proteomics. 2022 Jan 16;251:104397. doi: 10.1016/j.jprot.2021.104397. Epub 2021 Oct 20. J Proteomics. 2022. PMID: 34678517
-
Degradomics technologies in matrisome exploration.Matrix Biol. 2022 Dec;114:1-17. doi: 10.1016/j.matbio.2022.10.003. Epub 2022 Oct 22. Matrix Biol. 2022. PMID: 36280126 Review.
-
The extracellular matrix: Tools and insights for the "omics" era.Matrix Biol. 2016 Jan;49:10-24. doi: 10.1016/j.matbio.2015.06.003. Epub 2015 Jul 8. Matrix Biol. 2016. PMID: 26163349 Free PMC article. Review.
Cited by
-
Proteomic analysis of decellularized mice liver and kidney extracellular matrices.J Biol Eng. 2024 Feb 22;18(1):17. doi: 10.1186/s13036-024-00413-8. J Biol Eng. 2024. PMID: 38389090 Free PMC article.
-
Decellularized adipose-derived matrix from Superficial layers of abdominal adipose tissue exhibits superior capacity of adipogenesis compared to deep layers.Mater Today Bio. 2024 Sep 12;28:101235. doi: 10.1016/j.mtbio.2024.101235. eCollection 2024 Oct. Mater Today Bio. 2024. PMID: 39318374 Free PMC article.
-
Recent advances in extracellular matrix manipulation for kidney organoid research.Front Pharmacol. 2024 Nov 6;15:1472361. doi: 10.3389/fphar.2024.1472361. eCollection 2024. Front Pharmacol. 2024. PMID: 39568581 Free PMC article. Review.
References
MeSH terms
Substances
Grants and funding
LinkOut - more resources
Full Text Sources
