. 2023 Feb 1;24(3):2829.
doi: 10.3390/ijms24032829.

Monocyte-Derived miRNA-1914-5p Attenuates IL-1β-Induced Monocyte Adhesion and Transmigration

Affiliations

Monocyte-Derived miRNA-1914-5p Attenuates IL-1β-Induced Monocyte Adhesion and Transmigration

Kohki Toriuchi et al. Int J Mol Sci. .

Abstract

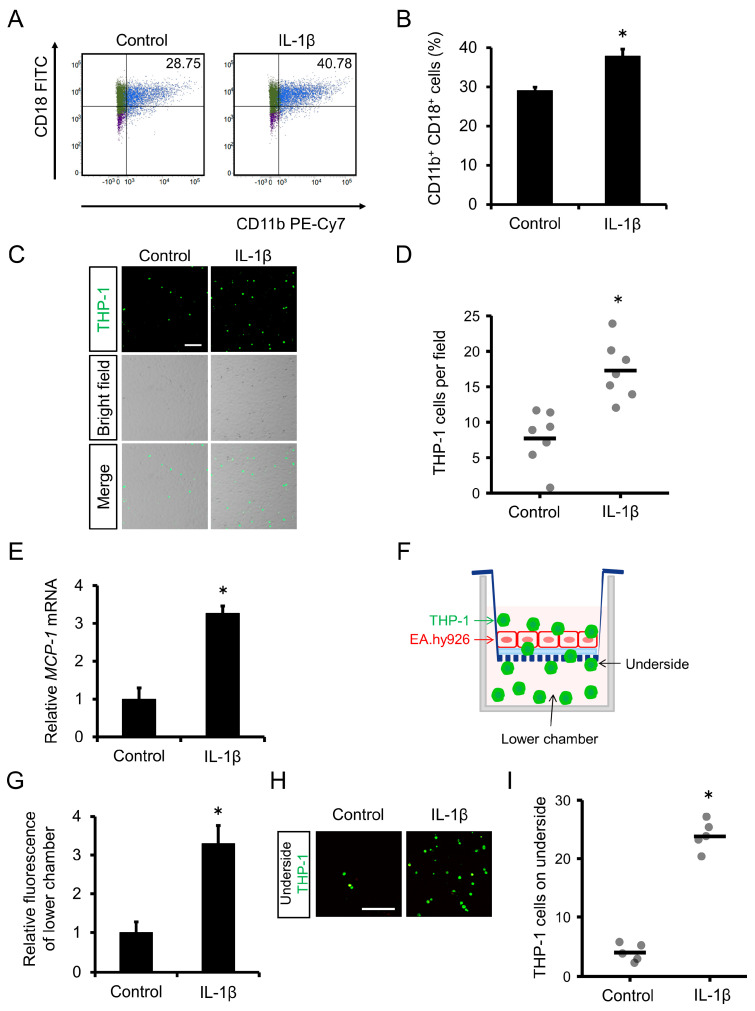
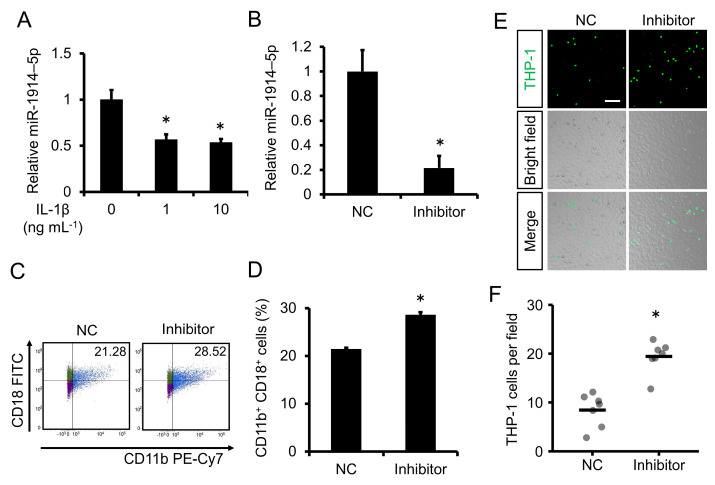
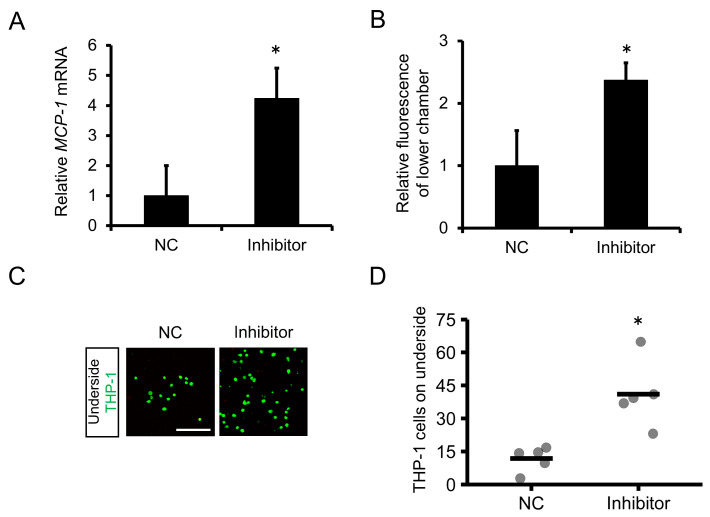
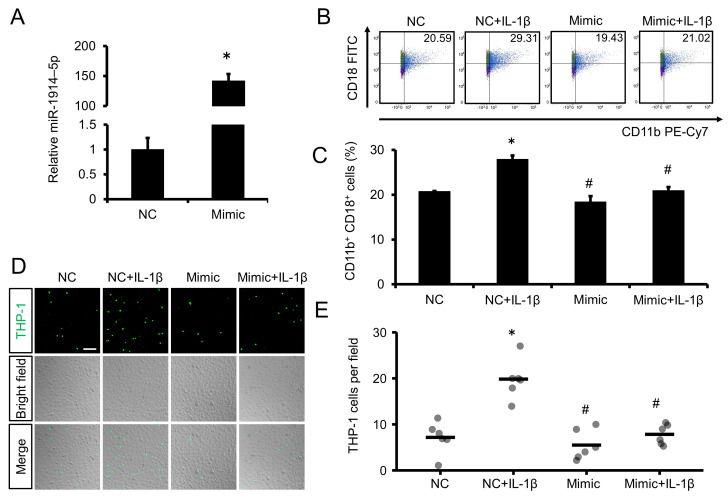
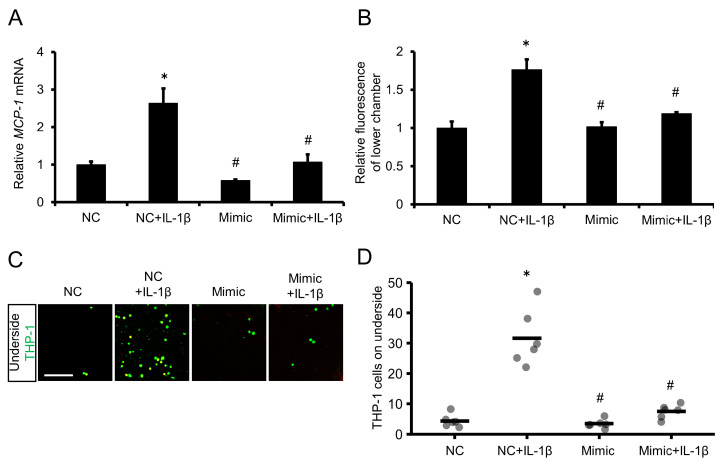
Atherosclerosis can lead to cardiovascular and cerebrovascular diseases. Atherosclerotic plaque formation is promoted by the accumulation of inflammatory cells. Therefore, modulating monocyte recruitment represents a potential therapeutic strategy. In an inflammatory state, the expression of adhesion molecules such as intercellular adhesion molecule-1 (ICAM-1) is upregulated in endothelial cells. We previously reported that miR-1914-5p in endothelial cells suppresses interleukin (IL)-1β-induced ICAM-1 expression and monocyte adhesion to endothelial cells. However, whether monocyte miR-1914-5p affects monocyte recruitment is unclear. In this study, IL-1β decreased miR-1914-5p expression in a human monocyte cell line. Moreover, miR-1914-5p inhibition enhanced adhesion to endothelial cells with the upregulation of macrophage-1 antigen (Mac-1), a counter-ligand to ICAM-1. Transmigration through the endothelial layer was also promoted with the upregulation of monocyte chemotactic protein-1 (MCP-1). Furthermore, a miR-1914-5p mimic suppressed IL-1β-induced monocyte adhesion and transmigration in monocytes with Mac-1 and MCP-1 downregulation. Further investigation of miR-1914-5p in monocytes could lead to the development of novel diagnostic markers and therapeutic strategies for atherosclerosis.

Keywords: MCP-1; Mac-1; atherosclerosis; miR-1914-5p; monocyte adhesion; monocyte transmigration.


Conflict of interest statement

The authors declare no conflict of interest.

Figures

Figure 1
Figure 1
Effect of IL-1β on monocyte adhesion to endothelial cells and transmigration. (A) THP-1 cells were incubated with IL-1β for 24 h, and Mac-1 expression was examined by flow cytometry. THP-1 cells expressing Mac-1 were defined as CD11b+, CD18+ cells. (B) Proportion of cells expressing Mac-1 (CD11b+, CD18+ cells) among live cells. n = 3 in each group. * p < 0.05 compared with the control group. (C) Adhesion of THP-1 cells to an EA.hy926 cell monolayer. Fluorescent THP-1 cells and EA.hy926 cells were co-cultured for 1 h after treatment of THP-1 cells with IL-1β (10 ng mL−1). Scale bar represents 100 μm. (D) Number of fluorescent THP-1 monocytes on the EA.hy926 cell monolayer. n = 7 fields in each group. * p < 0.05 compared with the control group. (E) THP-1 cells were incubated with IL-1β for 24 h, and MCP-1 gene expression was examined by qRT-PCR. n = 3 in each group. * p < 0.05 compared with the control group. (F) Schematic diagram of the transmigration assay. (G) Transmigration of THP-1 cells through the endothelial layer into the lower chamber was assessed by comparing the relative fluorescence intensity of the upper and lower chambers using a microplate reader. n = 3 in each group. * p < 0.05 compared with the vehicle group. (H) THP-1 cells that passed through the endothelial layer and adhered to the underside of the membrane were detected using a confocal microscope. THP-1 cells were labeled with the fluorescent dye BCECF-AM (green). Scale bar represents 100 μm. (I) The number of fluorescent THP-1 monocytes on the underside of the membrane was determined. n = 5 fields in each group. * p < 0.05 compared with the control group.
Figure 2
Figure 2
IL-1β decreased miR-1914-5p expression in monocytes, and transfection with a miR-1914-5p inhibitor increased monocyte adhesion to endothelial cells. (A) THP-1 cells were incubated with IL-1β for 24 h, and miR-1914-5p expression was examined by qRT-PCR. n = 3 in each group. * p < 0.05 compared with the vehicle group. (B) THP-1 cells were transfected with miR-1914-5p inhibitor or negative control (NC) inhibitor for 24 h. miR-1914-5p levels were then assessed by qRT-PCR. An inhibitor of miR-1914-5p significantly suppressed miR-1914-5p accumulation in THP-1 cells compared with the NC. n = 3 per group. * p < 0.05 compared with the NC transfected group. (C) Mac-1 expression in THP-1 cells was examined by flow cytometry after transfection with miR-1914-5p inhibitor or NC for 24 h. THP-1 cells expressing Mac-1 were defined as CD11b+, CD18+ cells. (D) Proportion of cells expressing Mac-1 (CD11b+, CD18+ cells) among live cells. n = 3 in each group. * p < 0.05 compared with the NC transfected group. (E) Adhesion of THP-1 cells to an EA.hy926 cell monolayer. Fluorescent THP-1 cells and EA.hy926 cells were co-cultured for 1 h after transfection with miR-1914-5p inhibitor or NC for 24 h. Scale bar represents 100 μm. (F) The number of fluorescent THP-1 monocytes on the EA.hy926 cell monolayer was determined. n = 7 fields in each group. * p < 0.05 compared with the NC transfected group.
Figure 3
Figure 3
Effect of miR-1914-5p inhibitor on transmigration of monocytes through an endothelial cell layer. (A) THP-1 cells were transfected with miR-1914-5p inhibitor or NC for 24 h, and MCP-1 gene expression was examined by qRT-PCR. n = 3 in each group. * p < 0.05 compared with the NC transfected group. (B) Monocyte transmigration through the endothelial cell layer was examined using a transmigration assay after transfection with miR-1914-5p inhibitor or NC for 24 h. Transmigration of THP-1 cells through the endothelial cell layer into the lower chamber was assessed by comparing the relative fluorescence intensity of the upper and lower chambers using a microplate reader. n = 3 in each group. * p < 0.05 compared with the NC transfected group. (C) Fluorescent images of the top and underside of the membrane. THP-1 cells were labeled with the fluorescent dye BCECF-AM (green). Scale bar represents 100 μm. (D) The number of fluorescent THP-1 monocytes on the underside of the membrane was determined. n = 5 fields in each group. * p < 0.05 compared with the NC transfected group.
Figure 4
Figure 4
Effect of miR-1914-5p mimic on IL-1β–induced adhesion of monocytes to endothelial cells. (A) THP-1 cells were transfected with miR-1914-5p mimic or NC mimic for 24 h. miR-1914-5p levels were then assessed by qRT-PCR. Compared with the NC, the mimic of miR-1914-5p significantly increased miR-1914-5p expression in THP-1 cells. n = 3 per group. * p < 0.05 compared with the NC transfected group. (B) THP-1 cells were transfected with miR-1914-5p mimic or NC for 24 h and then incubated with IL-1β for 24 h. After 24 h of IL-1β treatment, Mac-1 expression in THP-1 cells was examined by flow cytometry. THP-1 cells expressing Mac-1 were defined as CD11b+, CD18+ cells. (C) Proportion of cells expressing Mac-1 (CD11b+, CD18+ cells) among live cells. n = 3 in each group. * p < 0.05 compared with the NC group. # p < 0.05 compared with the NC+IL-1β group. (D) Adhesion of THP-1 cells to an EA.hy926 cell monolayer. THP-1 cells and EA.hy926 cells were co-cultured for 1 h after transfection and IL-1β exposure. Scale bar represents 100 μm. (E) The number of fluorescent THP-1 monocytes on the EA.hy926 cell monolayer was determined. n = 6 fields in each group. * p < 0.05 compared with the NC group. # p < 0.05 compared with the NC+IL-1β group.
Figure 5
Figure 5
Transfection with miR-1914-5p mimic suppressed IL-1β–induced transmigration of monocytes through an endothelial cell layer. (A) THP-1 cells were transfected with miR-1914-5p mimic or NC for 24 h and then incubated with IL-1β for 24 h. MCP-1 gene expression was examined by qRT-PCR. n = 3 in each group. * p < 0.05 compared with the NC group. # p < 0.05 compared with the NC+IL-1β group. (B) Monocyte transmigration through an endothelial cell layer was examined using a transmigration assay after transfection and IL-1β exposure. Transmigration of THP-1 cells through the endothelial cell layer into the lower chamber was assessed by comparing the relative fluorescence intensity of the upper and lower chambers using a microplate reader. n = 3 in each group. * p < 0.05 compared with the NC group. # p < 0.05 compared with the NC+IL-1β group. (C) Fluorescent images of the top and underside of the membrane. THP-1 cells were labeled with the fluorescent dye BCECF-AM (green). Scale bar represents 100 μm. (D) The number of fluorescent THP-1 monocytes on the underside of the membrane was determined. n = 6 fields in each group. * p < 0.05 compared with the NC group. # p < 0.05 compared with the NC+IL-1β group.

Similar articles

Cited by

References

    1. Hansson G.K., Robertson A.K.L., Söderberg-Nauclér C. Inflammation and Atherosclerosis. Annu. Rev. Pathol. 2006;1:297–329. doi: 10.1146/annurev.pathol.1.110304.100100. - DOI - PubMed
    1. Li A.C., Glass C.K. The Macrophage Foam Cell as a Target for Therapeutic Intervention. Nat. Med. 2002;8:1235–1242. doi: 10.1038/nm1102-1235. - DOI - PubMed
    1. Moore K.J., Sheedy F.J., Fisher E.A. Macrophages in Atherosclerosis: A Dynamic Balance. Nat. Rev. Immunol. 2013;13:709–721. doi: 10.1038/nri3520. - DOI - PMC - PubMed
    1. Saha P., Modarai B., Humphries J., Mattock K., Waltham M., Burnand K.G., Smith A. The Monocyte/Macrophage as a Therapeutic Target in Atherosclerosis. Curr. Opin. Pharmacol. 2009;9:109–118. doi: 10.1016/j.coph.2008.12.017. - DOI - PubMed
    1. Ley K., Laudanna C., Cybulsky M.I., Nourshargh S. Getting to the Site of Inflammation: The Leukocyte Adhesion Cascade Updated. Nat. Rev. Immunol. 2007;7:678–689. doi: 10.1038/nri2156. - DOI - PubMed

MeSH terms

Substances