. 2023 Feb 2;24(3):2908.
doi: 10.3390/ijms24032908.

ER-PM Junctions on GABAergic Interneurons Are Organized by Neuregulin 2/VAP Interactions and Regulated by NMDA Receptors

Affiliations

ER-PM Junctions on GABAergic Interneurons Are Organized by Neuregulin 2/VAP Interactions and Regulated by NMDA Receptors

Detlef Vullhorst et al. Int J Mol Sci. .

Abstract

Neuregulins (NRGs) signal via ErbB receptors to regulate neural development, excitability, synaptic and network activity, and behaviors relevant to psychiatric disorders. Bidirectional signaling between NRG2/ErbB4 and NMDA receptors is thought to homeostatically regulate GABAergic interneurons in response to increased excitatory neurotransmission or elevated extracellular glutamate levels. Unprocessed proNRG2 forms discrete clusters on cell bodies and proximal dendrites that colocalize with the potassium channel Kv2.1 at specialized endoplasmic reticulum-plasma membrane (ER-PM) junctions, and NMDA receptor activation triggers rapid dissociation from ER-PM junctions and ectodomain shedding by ADAM10. Here, we elucidate the mechanistic basis of proNRG2 clustering at ER-PM junctions and its regulation by NMDA receptors. Importantly, we demonstrate that proNRG2 promotes the formation of ER-PM junctions by directly binding the ER-resident membrane tether VAP, like Kv2.1. The proNRG2 intracellular domain harbors two non-canonical, low-affinity sites that cooperatively mediate VAP binding. One of these is a cryptic and phosphorylation-dependent VAP binding motif that is dephosphorylated following NMDA receptor activation, thus revealing how excitatory neurotransmission promotes the dissociation of proNRG2 from ER-PM junctions. Therefore, proNRG2 and Kv2.1 can independently function as VAP-dependent organizers of neuronal ER-PM junctions. Based on these and prior studies, we propose that proNRG2 and Kv2.1 serve as co-regulated downstream effectors of NMDA receptors to homeostatically regulate GABAergic interneurons.

Keywords: ER-PM junction; FFAT; GABAergic interneuron; Kv2.1; NMDA receptor; VAP; neuregulin 2.


Conflict of interest statement

The authors declare no conflict of interest.

Figures
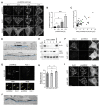
Figure 1
Figure 1
ProNRG2 organizes ER-PM junctions in ErbB4+ GABAergic interneurons. (A,B) Augmenting proNRG2 expression by AAV-mediated transduction dose-dependently increases proNRG2 cluster size without signs of diffuse surface distribution; indicated volumes are per 24-well. Note the concomitant increase in Kv2.1 cluster size that is particularly evident in the 0.5 µL condition. ProNRG2 cluster sizes shown in (B) represent the mean ± SEM (n = 713 (0.1 µL), 1211 (0.2 µL), 907 (0.3 µL), 1044 (0.5 µL) clusters from 11–13 ErbB4+ neurons per condition and two independent experiments). *, p < 0.05; ****, p < 0.0001; ns, not significant (one-way ANOVA). (C), Scatter plot illustrating the correlation of proNRG2 and Kv2.1 mean cluster sizes in neurons overexpressing proNRG2 (n = 60 neurons from three independent experiments). Colored data points are from neurons shown in panel A (magenta: 0.1 µL; blue: 0.2 µL; green: 0.3 µL; orange: 0.5 µL AAV). (D), Representative electron micrographs showing dense patches of the proNRG2 immunogold signal at the plasma membrane (marked by asterisks) that align with the underlying SSC. The top micrograph shows a small patch of proNRG2 signal that is concentrated over the center of the SSC while sparing its periphery. This distribution resembles endogenous proNRG2 that is frequently found at the open center of doughnut-shaped Kv2.1 clusters [8]. Note the lack of signal outside of the junctional region (arrowheads) and the extensive alignment of the very large proNRG2 cluster with the underlying SSC in the bottom image. See also Figure S1 for uncropped overviews and magnified areas without SSC shading. (E), shRNA-mediated knockdown dramatically reduces Kv2.1 protein levels in AAV-transduced neurons expressing a potent Kv2.1 shRNA compared to neurons transduced with nontargeting control (NTC) or untransduced neurons (UTC). GFP and tubulin signals included as transduction and loading controls, respectively. (F), Similar proNRG2 clusters are found in ErbB4+ GABAergic interneurons under both control (NTC) and Kv2.1 knockdown conditions (Kv2.1-KD). (G), Superresolution (Airyscan) micrograph of a Kv2.1 knockdown neuron, with two regions of interest magnified below, showing examples of proNRG2 puncta either accompanied by a residual Kv2.1 signal (ROI1; open arrowheads) or lacking a detectable Kv2.1 signal (ROI2; filled arrowheads). (H), Kv2.1 knockdown does not affect the number of ErbB4+ neurons with proNRG2 puncta compared to nontargeting (UTC) or untransduced control (NTC) neurons; data represent the mean ± SEM of 275 (NTC), 250 (Kv2.1-KD), and 245 (UTC) neurons from three independent experiments. ns, p > 0.05 (Kruskal–Wallis test). (I), Kv2.1 knockdown does not affect the clustering of overexpressed proNRG2 in neurons co-transduced with AAVs expressing shRNA and proNRG2. (J), Electron micrograph of a Kv2.1 knockdown neuron showing an extensive patch of proNRG2 immunogold signal at the plasma membrane that is accompanied by a similarly long SSC. See also Figure S1 for uncropped overviews and magnified areas without SSC shading. Scale bars: (A,F,G) (overviews) and (I) = 10 µm; (D) = 100 nm (top) and 200 nm (bottom); (G) = 2 µm (ROIs); (J) = 200 nm.
Figure 2
Figure 2
ProNRG2 and VAP co-immunoprecipitate in cultured neurons, brain tissue, and heterologous cells. (A), IP of epitope-tagged proNRG2 from transduced neuron lysates co-immunoprecipitates VAP detected with mouse monoclonal antibody clone N479/107 against VAPA/B [48], whereas VAP is not detected in the negative control IP lane (nc) using an isotype-matched negative control antibody (anti-GFP; clone N86/6). Importantly, unlike VAP, Kv2.1 is not detected in the V5-IP lane. The asterisk (*) indicates that input and unbound fractions were diluted fivefold for VAP detection. (B), Likewise, proNRG2 is detected along with Kv2.1 in parallel VAPA-IP samples prepared from the same neuron lysates. (C), VAP co-immunoprecipitates with proNRG2 from mouse whole brain lysates following IP with a rabbit polyclonal NRG2 antibody against the extracellular domain (ABN1654). nc, negative control antibody (normal rabbit IgG). (D,E), ProNRG2 and VAP also co-immunoprecipitate in NRG2-transfected 293 cells. IP controls include lysates prepared from cells transfected with proNRG2 lacking the V5 epitope used for IP (no tag) and negative control IP antibodies (anti-GFP in (D); normal rabbit IgG in (E)). (F), Increasing proNRG2 expression in AAV-transduced neurons (0–8 µL per six-well) dose-dependently augments VAP co-immunoprecipitation signals. (G), Densitometric analysis of proNRG2/VAP signals shown in (F). Data are normalized to values obtained for 8 µL AAV (n = three independent experiments).
Figure 3
Figure 3
ProNRG2 interacts with VAPA and VAPB isoforms, and binding requires an intact FFAT binding site in VAP. (A), ProNRG2 co-immunoprecipitates both VAPA and VAPB in 293 cells transfected with untagged proNRG2 and V5-tagged VAPA/B, as indicated. Cells in the negative control lanes were transfected with proNRG2 but not VAP (no VAP). (B), Single-plane confocal micrographs showing colocalization of VAPA clusters (top) and VAPB clusters (bottom) with surface proNRG2 in transfected HeLa cells. Arrowheads in magnified ROIs indicate examples of overlapping proNRG2/VAP signals. Note that proNRG2 was live-labeled with a fluorescently conjugated nanobody against the ALFA tag inserted upstream of the EGF-like domain. DAPI was included to label nuclei. (C), ProNRG2/VAP co-immunoprecipitation requires a functional FFAT binding site. Neurons were transduced with AAVs for V5-tagged proNRG2 and GFP-tagged wild-type (WT) or mutant (Mut; K87D/M89D) VAPA. Note that endogenous VAP is detected in both IP samples. (D), Single-plane confocal micrographs showing co-clustering of WT VAPA-GFP with ALFA-tagged proNRG2 (top; arrows in ROI) but not of mutant VAPA-GFP (bottom) in transfected HeLa cells. ProNRG2 was live-labeled as described in panel (B), and DAPI was included to label nuclei. Magnified ROIs in (B,D) include single and merged channels for proNRG2/alfa and VAP-GFP. Scale bars in (B,D): overviews = 10 µm; ROIs = 2 µm.
Figure 4
Figure 4
Role of C- and D-boxes in proNRG2/VAP interactions. (A), Schematic illustration of proNRG2 and C/D-box deletions constructs. Locations of C- and D-boxes in the ICD, EGF-like (EGF) and Ig-like (Ig-L) domains in the ECD, transmembrane domain (TM), and V5 epitope tag used for IP are shown. (B), Representative Western blot confirming comparable expression levels of proNRG2 constructs in neuron lysates (top) and showing corresponding VAP co-immunoprecipitation results (bottom). nc, untransduced control. (C), Densitometric quantification of VAP co-immunoprecipitation band intensities; note that only WT proNRG2 co-immunoprecipitates VAP. Data are normalized to VAP co-immunoprecipitation signals obtained with WT proNRG2 (n = four independent experiments). (D), Confocal micrographs of surface-labeled proNRG2 showing differences in clustering between WT and deletion variants. ProNRG2 signals in the panels above were obtained using the same laser intensity across all variants and are shown in magenta (top) and as a 16-color heat map (middle). Kv2.1 signals in green are included for reference (bottom). The second heat map in the panel below was obtained by individually adjusting laser intensities for each proNRG2 variant to better visualize diffusely distributed low-intensity signals obtained with the ΔCΔD and, to a lesser extent, the ΔC variants. ROIs used for line scan densitometry in panel (E) are indicated. (E), Magnified ROIs from panel (D), showing the location of the lines used for densitometry (top) and the corresponding line scan densitometry graphs (bottom). Filled and open arrowheads in the ΔC panel indicate examples of proNRG2 clusters that respectively colocalize with Kv2.1 or that are located in the open centers of doughnut-shaped Kv2.1 clusters. By contrast, theΔD variant readily clusters, although clusters co-localize only partially with Kv2.1 (see also panel (G). (F), Quantitative analysis of proNRG2 cluster size. Data represent the means ± SEM (# of clusters analyzed: 2197 (WT); 798 (ΔC); 2726 (ΔD)) from 23–24 ErbB4+ neurons per variant and two independent experiments. The ΔCΔD variant was not included, as most analyzed neurons lacked detectable clusters. ***, p < 0.001; ****, p < 0.0001 (one-way ANOVA). (G), Unlike WT proNRG2, which overlaps extensively with Kv2.1 (left, open arrowheads), clustered proNRG2ΔD signals are strongest in areas immediately adjacent to Kv2.1 clusters (right, filled arrowheads). ROIs indicated in overview images are magnified on the right and shown as separate and merged channels. Scale bars: 10 µm ((D), overviews in (G)) and 2 µm ((E), ROIs in (G)).
Figure 5
Figure 5
The proNRG2 C-box harbors a phosphorylation-dependent VAP binding site, and VAP binding is regulated by NMDA receptor activity. (A), Schematic illustration of WT and point-mutated C- and D-box sequences in the proNRG2 ICD, with targeted putative Ser/Thr phosphorylation sites indicated. (B), Representative co-immunoprecipitation Western blot of AAV-transduced neurons showing proNRG2 signals in cell lysates above and VAP co-immunoprecipitation signals below. The blot illustrates how rendering Ser/Thr residues in the C-box (proNRG2_8A and 5A), but not the D-box (proNRG2_3A), nonphosphorylatable affects proNRG2 electrophoretic mobility and abolishes VAP co-immunoprecipitation. (C), Densitometric analysis of VAP co-immunoprecipitation signals. Data are normalized to WT proNRG2 and represent the mean ± SD (n = four independent experiments). (D), Schematic illustration of GST-NRG2_CD and GST-only negative control bait proteins used in pulldown experiments. Ser/Thr -> Asp substitutions in the C-box are indicated above, and the sequences as well as the net charges of competing C- and D-box peptides are shown below (mutated residues highlighted in red). (E), Representative Western blot showing VAP signals after pulldown from untransduced neuron lysates with GST or GST-NRG2_CD bait proteins, either in the absence or presence of competing peptides, as indicated. Note that only the phospho-mimicking C-box peptide C-PM and the WT D-box peptide successfully compete for VAP binding, whereas neither C-WT nor D-2K peptides compete. (F), Summary analysis of representative results shown in (E). Data are plotted as normalized VAP signal intensities (NRG2/no peptide = 1) and represent the mean ± SEM (n = three independent experiments). (G), NMDA receptor stimulation (NMDA; 50 µM) increases crNRG2 electrophoretic mobility indicative of dephosphorylation (top) and decreases VAP signals in the corresponding immunoprecipitation samples (bottom). (H), Summary analysis of representative results shown in (G). Data are plotted as normalized VAP signal intensities (Ctrl = 1) and represent the mean ± SEM (n = four independent experiments). *, p < 0.05; ****, p < 0.0001 (one-way ANOVA).
Figure 6
Figure 6
Working model of proNRG2/VAP interactions. The schematic depicts a single proNRG2 molecule cooperatively engaging with a VAP dimer via its two noncanonical, low-affinity FFAT motifs located in the C- and D-boxes. Interactions between the VAP MSP domain and the cryptic FFAT site in the C-box require phosphorylation of Ser/Thr residues. Conversely, their dephosphorylation downstream of NMDA receptor activation promotes the dissociation of proNRG2 from VAP. See Discussion for further details.

References

    1. Meyer D., Yamaai T., Garratt A., Riethmacher-Sonnenberg E., Kane D., Theill L.E., Birchmeier C. Isoform-specific expression and function of neuregulin. Development. 1997;124:3575–3586. doi: 10.1242/dev.124.18.3575. - DOI - PubMed
    1. Bao J., Wolpowitz D., Role L.W., Talmage D.A. Back signaling by the Nrg-1 intracellular domain. J. Cell Biol. 2003;161:1133–1141. doi: 10.1083/jcb.200212085. - DOI - PMC - PubMed
    1. Michailov G.V., Sereda M.W., Brinkmann B.G., Fischer T.M., Haug B., Birchmeier C., Role L., Lai C., Schwab M.H., Nave K.A. Axonal neuregulin-1 regulates myelin sheath thickness. Science. 2004;304:700–703. doi: 10.1126/science.1095862. - DOI - PubMed
    1. Rieff H.I., Raetzman L.T., Sapp D.W., Yeh H.H., Siegel R.E., Corfas G. Neuregulin induces GABA(A) receptor subunit expression and neurite outgrowth in cerebellar granule cells. J. Neurosci. 1999;19:10757–10766. doi: 10.1523/JNEUROSCI.19-24-10757.1999. - DOI - PMC - PubMed
    1. Vaskovsky A., Lupowitz Z., Erlich S., Pinkas-Kramarski R. ErbB-4 activation promotes neurite outgrowth in PC12 cells. J. Neurochem. 2000;74:979–987. doi: 10.1046/j.1471-4159.2000.0740979.x. - DOI - PubMed

MeSH terms