. 2023 Feb 3;24(3):2964.
doi: 10.3390/ijms24032964.

Hepatic Glucose Metabolism Disorder Induced by Adipose Tissue-Derived miR-548ag via DPP4 Upregulation

Affiliations

Hepatic Glucose Metabolism Disorder Induced by Adipose Tissue-Derived miR-548ag via DPP4 Upregulation

Xiaolong Chu et al. Int J Mol Sci. .

Abstract

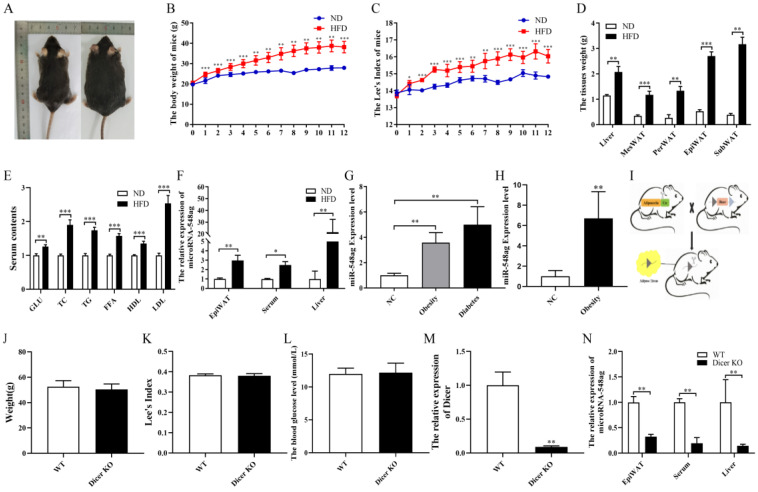
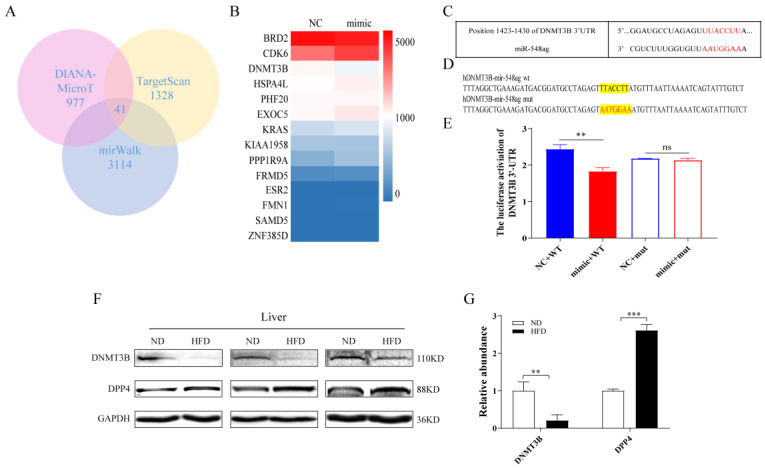
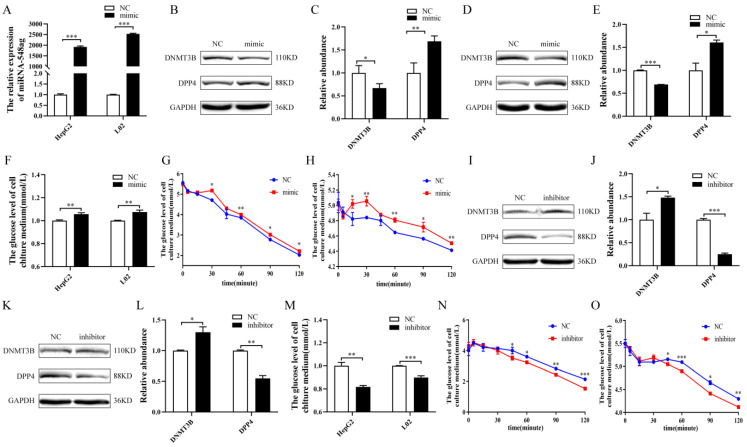
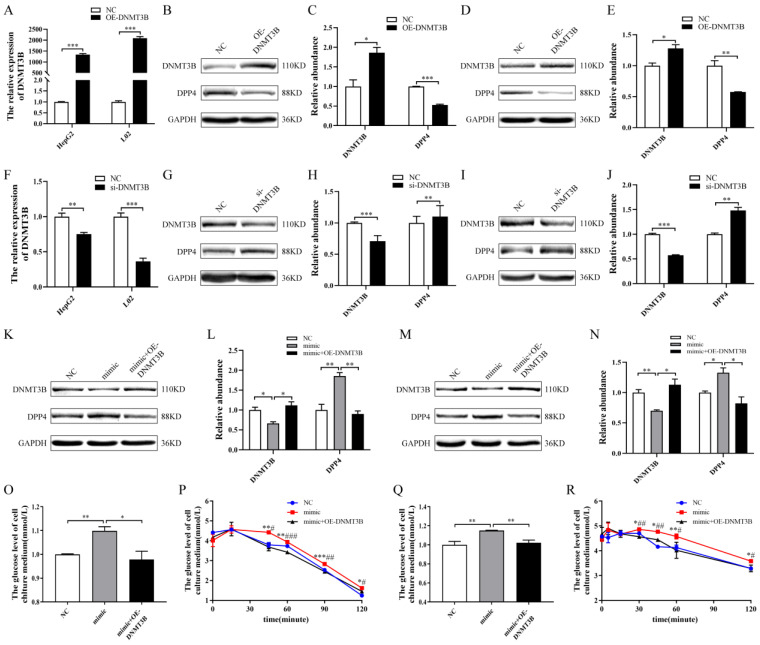
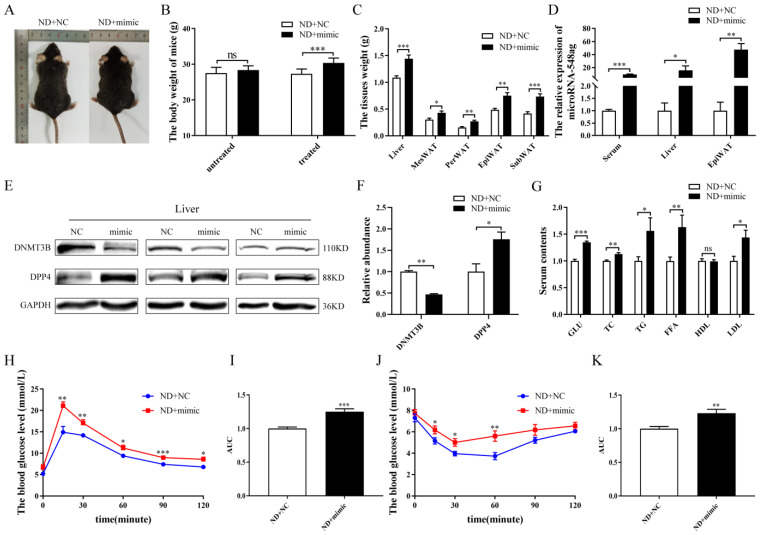
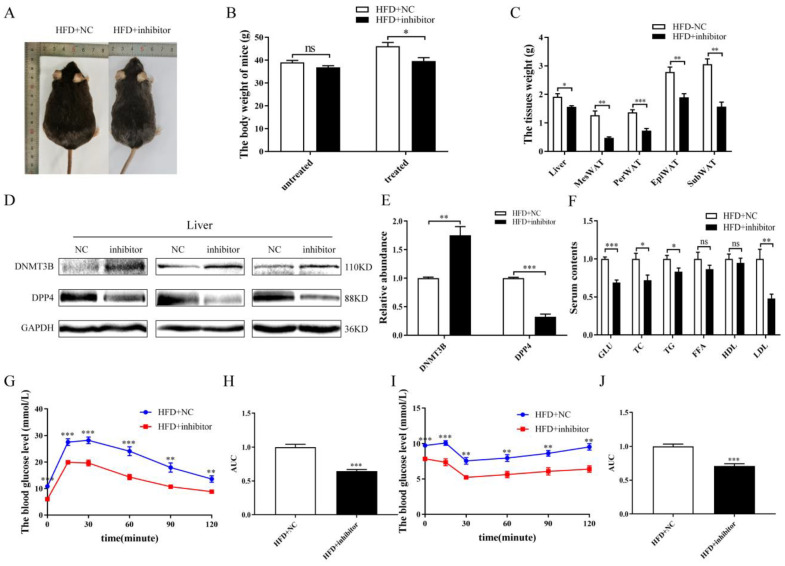
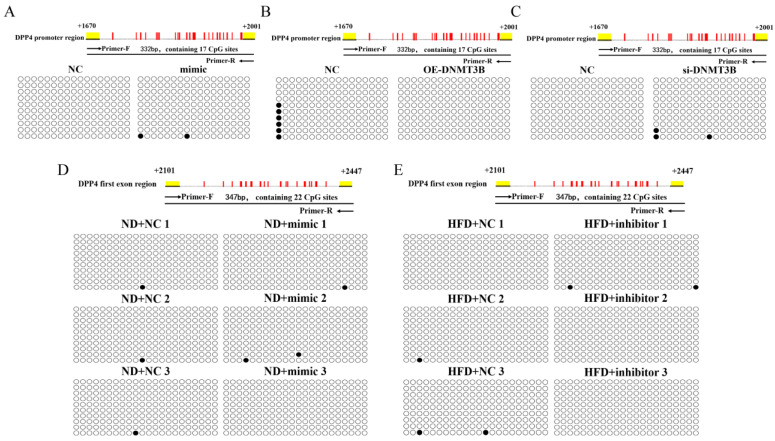
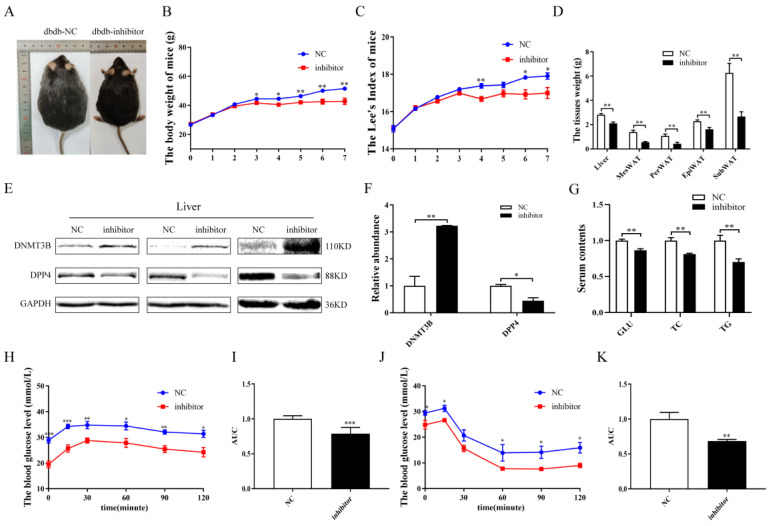
The present study aimed to explore the molecular mechanism underlying the regulation of glucose metabolism by miR-548ag. For the first time, we found that miR-548ag expression was elevated in the abdominal adipose tissue and serum of subjects with obesity and type 2 diabetes mellitus (T2DM). The conditional knockout of adipose tissue Dicer notably reduced the expression and content of miR-548ag in mouse adipose tissue, serum, and liver tissue. The combined use of RNAseq, an miRNA target gene prediction software, and the dual luciferase reporter assay confirmed that miR-548ag exerts a targeted regulatory effect on DNMT3B and DPP4. miR-548ag and DPP4 expression was increased in the adipose tissue, serum, and liver tissue of diet-induced obese mice, while DNMT3B expression was decreased. It was subsequently confirmed both in vitro and in vivo that adipose tissue-derived miR-548ag impaired glucose tolerance and insulin sensitivity by inhibiting DNMT3B and upregulating DPP4. Moreover, miR-548ag inhibitors significantly improved the adverse metabolic phenotype in both obese mice and db/db mice. These results revealed that the expression of the adipose tissue-derived miR-548ag increased in obese subjects, and that this could upregulate the expression of DPP4 by targeting DNMT3B, ultimately leading to glucose metabolism disorder. Therefore, miR-548ag could be utilized as a potential target in the treatment of T2DM.

Keywords: DNMT3B; DPP4; T2DM; miR-548ag; obesity.


Conflict of interest statement

The authors declare no conflict of interest.

Figures

Figure 1
Figure 1
Effect of obesity on miR-548ag expression levels. (A) The gross morphology of the ND and HFD mice. (B) The body weight (n = 8). (C) Lee’s index (n = 8). (D) The weights of the liver, mesenteric adipose tissue (MesWAT), perirenal adipose tissue (PerWAT), epididymal adipose tissue (EpiWAT), and subcutaneous adipose tissue (SubWAT) (n = 8). (E) The levels of blood glucose, TC, TG, FFA, HDL, and LDL (n = 8). (F) The levels of miR-548ag in the serum, the liver, and the EpiWAT of the mice (n = 6). (G) The serum miR-548ag levels as determined from serum samples from the normal weight (NC, n = 61), obesity (n = 103), and diabetes (n = 56) groups. (H) The miR-548ag levels in the abdominal adipose tissue as determined from abdominal adipose tissue samples from the NC (n = 8) and obesity (n = 11) groups. (I) Construction of the adipose tissue Dicer knockout mouse model. (JL) The body weight, Lee’s index, and fasting glucose levels in the adipose tissue Dicer knockout mice (n = 6). (M) The expression of Dicer in the adipose tissue (n = 6). (N) The expression of miR-548ag in the EpiWAT, serum, and liver tissue of the adipose tissue Dicer knockout mice (n = 6). (The p-values from the t-test and non-parametric rank sum test are indicated. The data are presented as mean ± SEM. * p < 0.05, ** p < 0.01, and *** p < 0.001 indicate a significant difference.)
Figure 2
Figure 2
The prediction of the downstream target gene of miR-548ag. (A) The DIANA-MicroT, TargetScan, and miRWalk databases were employed to predict the key downstream genes of miR-548ag, and the intersection of the three databases was determined. (B) The transcriptome sequencing analysis of mir-548ag upregulated in HepG2 cells. (C) The TargetScan database analysis of the miR-548ag binding sites for DNMT3B. (D) Construction of a dual luciferase reporter gene plasmid for DNMT3B. (E) Analysis of the results of the dual luciferase reporter assay. (F,G) The protein expressions of DNMT3B and DPP4 in the liver. (The p-values obtained in the t-test and non-parametric rank sum test are indicated. The data are presented as mean ± SEM. ** p < 0.01, and *** p < 0.001 indicate a significant difference.)
Figure 3
Figure 3
Effect of miR-548ag on the expressions of DNMT3B and DPP4. (A) The expression of miR-548ag in HepG2 and L02 cells was upregulated when 50 nM of miR-548ag mimic was used. (BE) The protein expressions of DNMT3B and DPP4 in HepG2 and L02 cells after the overexpression of miR-548ag. (F) The glucose consumption, (G,H) insulin sensitivity, and (IL) protein expressions of DNMT3B and DPP4 in HepG2 and L02 cells after transfection with 100 nM miR-548ag inhibitor for 24 h. (M) Glucose consumption after the inhibition of miR-548ag. (N,O) Insulin sensitivity after the inhibition of miR-548ag. (The p-values obtained in the t-test and non-parametric rank sum test are indicated. The data are presented as mean ± SEM. * p < 0.05, ** p < 0.01, and *** p < 0.001 indicate a significant difference).
Figure 4
Figure 4
Rescue assay of HepG2 and L02 cells. (A) The mRNA expression of DNMT3B in HepG2 and L02 cells when 4 µg/mL and 1 µg/mL concentrations of DNMT3B-overexpression plasmid were used, respectively. (BE) The protein expressions of DNMT3B and DPP4 in HepG2 and L02 cells after the overexpression of DNMT3B. (F) The mRNA expression of DNMT3B in HepG2 and L02 cells when 80 nM and 40 nM of the DNMT3B interference fragments were used, respectively. (GJ) The protein expressions of DNMT3B and DPP4 in HepG2 and L02 cells after the downregulation of DNMT3B. (KN) The protein expressions of DNMT3B and DPP4 in HepG2 and L02 cells after overexpressing miR-548ag and upregulating DNMT3B simultaneously. (O,P) The glucose consumption and insulin sensitivity in HepG2 cells after overexpressing miR-548ag and upregulating DNMT3B simultaneously. (Q,R) The glucose consumption and insulin sensitivity in L02 cells after overexpressing miR-548ag and upregulating DNMT3B simultaneously. (The p-values obtained in the t-test and non-parametric rank sum test are indicated. The data are presented as mean ± SEM. * p < 0.05, ** p < 0.01, and *** p < 0.001 indicate a significant difference, Figure P and Figure R, mimic group vs. NC group; * p < 0.05, ** p < 0.01, and *** p < 0.001 indicate a significant difference, mimic group vs. mimic + ad-DNMT3B group; # p < 0.05, ## p < 0.01, and ### p < 0.001 indicate a significant difference).
Figure 5
Figure 5
Effect of miR-548ag on the expression levels of DNMT3B and DPP4 in vivo. (A) The gross morphology of ND + NC and ND + mimic mice. (B) Comparison of body weights prior to and after the intraperitoneal injection of the mimic (n = 8). (C) The weights of the liver and adipose tissues (n = 8). (D) The levels of miR-548ag in the serum, liver tissue, and EpiWAT of the mice (n = 6). (E,F) The protein expressions of DNMT3B and DPP4 in the liver. (G) The levels of blood glucose, TC, TG, FFA, HDL, and LDL (n = 8). (H) IPGTT assay results (n = 8). (I) The quantification of glucose tolerance. (J) ITT assay results (n = 8). (K) The quantification of insulin sensitivity. (The p-values obtained in the t-test and non-parametric rank sum test are indicated. The data are presented as mean ± SEM. * p < 0.05, ** p < 0.01, and *** p < 0.001 indicate a significant difference).
Figure 6
Figure 6
Effect of the miR-548ag inhibitor on the expressions of DNMT3B and DPP4 in vivo. (A) The gross morphology of the HFD + NC and HFD + inhibitor mice. (B) Comparison of the body weights prior to and after the intraperitoneal injection of the inhibitor (n = 8). (C) The weights of the liver and adipose tissues (n = 8). (D,E) The protein expressions of the DNMT3B and DPP4 in the liver (F) The levels of blood glucose, TC, TG, FFA, HDL, and LDL (n = 8). (G) IPGTT assay results (n = 8). (H) The quantification of glucose tolerance. (I) ITT assay results (n = 8). (J) The quantification of insulin sensitivity. (The p-values obtained in the t-test and non-parametric rank sum test are indicated. The data are presented as mean ± SEM. * p < 0.05, ** p < 0.01, and *** p < 0.001 indicate a significant difference).
Figure 7
Figure 7
The BSP experiment. (A) Schematic diagram of the methylation status of the CpG sites in the promoter region of the DPP4 gene. HepG2 cells were transfected with 50 nM miR-548ag mimic for 24 h after the upregulation of miR-548ag. (B,C) The schematic diagrams of the methylation status of the CpG sites in the promoter region of the DPP4 gene. The transfection of 4 µg/mL of the DNMT3B-overexpression plasmid and 40 nM of the DNMT3B interference fragment into HepG2 cells was performed for 24 h after the up/down-regulation of DNMT3B. (D) The methylation status of the CpG sites in the promoter region of the mouse liver DPP4 gene. Adenovirus particles encoding the miR-548ag mimic were injected intraperitoneally into the normal diet-fed mice for 6 weeks. (E) Schematic diagram of the methylation status of the CpG sites in the promoter region of the mouse liver DPP4 gene. Adenovirus particles with the miR-548ag inhibitor were injected intraperitoneally into the HFD-induced obese mice for 6 weeks. ○ represents the non-methylated CpG site; ● represents the methylated CpG site.
Figure 8
Figure 8
Effect of the miR-548ag inhibitor on db/db mice. (A) The gross morphology of the db/db + NC and db/db + inhibitor mice. (B) Comparison of the body weights prior to and after the intraperitoneal injection of the inhibitor (n = 6). (C) Lee’s index (n = 6). (D) The weight of the liver tissue, MesWAT, PerWAT, EpiWAT, and SubWAT (n = 6). (E,F) The protein expressions of DNMT3B and DPP4 in the liver. (G) The levels of blood glucose, TC, and TG (n = 6). (H) IPGTT assay results (n = 6). (I) The quantification of glucose tolerance. (J) ITT assay results (n = 6). (K) The quantification of insulin sensitivity. (The p-values obtained in the t-test and non-parametric rank sum test are indicated. The data are presented as mean ± SEM. * p < 0.05, ** p < 0.01, and *** p < 0.001 indicate a significant difference.)

Similar articles

Cited by

References

    1. Frigolet M.E., Gutiérrez-Aguilar R. The colors of adipose tissue. Los colores del tejido adiposo. Gac. Médica México. 2020;156:142–149. - PubMed
    1. Ou X.H., Zhu C.C., Sun S.C. Effects of obesity and diabetes on the epigenetic modification of mammalian gametes. J. Cell Physiol. 2019;234:7847–7855. doi: 10.1002/jcp.27847. - DOI - PubMed
    1. Kim M., Oh J.K., Sakata S., Liang I., Park W., Hajjar R.J., Lebeche D. Role of resistin in cardiac contractility and hypertrophy. J. Mol. Cell Cardiol. 2008;45:270–280. doi: 10.1016/j.yjmcc.2008.05.006. - DOI - PMC - PubMed
    1. Blüher M. Adipokines—Removing road blocks to obesity and diabetes therapy. Mol Metab. 2014;3:230–240. doi: 10.1016/j.molmet.2014.01.005. - DOI - PMC - PubMed
    1. Yiannikouris F., Gupte M., Putnam K., Cassis L. Adipokines and blood pressure control. Curr. Opin. Nephrol. Hypertens. 2010;19:195–200. doi: 10.1097/MNH.0b013e3283366cd0. - DOI - PMC - PubMed