. 2023 Jan 28;16(3):1130.
doi: 10.3390/ma16031130.

Band Structure, Phonon Spectrum and Thermoelectric Properties of Ag3CuS2

Affiliations

Band Structure, Phonon Spectrum and Thermoelectric Properties of Ag3CuS2

Dmitry Pshenay-Severin et al. Materials (Basel). .

Abstract

Sulfides and selenides of copper and silver have been intensively studied, particularly as potentially efficient thermoelectrics. Ag3CuS2 (jalpaite) is a related material. However very little is known about its physical properties. It has been found that the compound undergoes several structural phase transitions, having the tetrahedral structural modification I41/amd at room temperature. In this work, its band structure, phonon spectrum and thermoelectric properties were studied theoretically and experimentally. Seebeck coefficient, electrical conductivity and thermal conductivity were measured in a broad temperature range from room temperature to 600 K. These are the first experimental data on transport properties of jalpaite. Ab initio calculations of the band structure and Seebeck coefficient were carried out taking into account energy dependence of the relaxation time typical for the scattering of charge carriers by phonons. The results of the calculations qualitatively agree with the experiment and yield large values of the Seebeck coefficient characteristic for lightly doped semiconductor. The influence of intrinsic defects (vacancies) on the transport properties was studied. It was shown that the formation of silver vacancies is the most probable and leads to an increase of hole concentration. Using the temperature dependent effective potential method, the phonon spectrum and thermal conductivity at room temperature were calculated. The measurements yield low lattice thermal conductivity value of 0.5 W/(m K) at 300 K, which is associated with the complex crystal structure of the material. The calculated room temperature values of the lattice thermal conductivity were also small (0.14-0.2 W/(m K)).

Keywords: Seebeck coefficient; electric conductivity; jalpaite; thermal conductivity; thermoelectric properties.


Conflict of interest statement

The authors declare no conflict of interest.

Figures

Figure 1
Figure 1
Body-centered tetragonal unit cell of Ag3CuS2 in jalpaite I41/amd structure (left panel). Ag, Cu and S atoms are depicted using gray, brown and yellow spheres, respectively. Redistribution of electron density (right panel). The yellow contours correspond to an increase, and the cyan contours correspond to a decrease in the electron density compared to the electron density of atoms placed at the same positions.
Figure 2
Figure 2
X-ray experimental diffraction pattern of Ag3CuS2 and simulated X-ray diffraction of I41/amd structure.
Figure 3
Figure 3
Thermal conductivity of Ag3CuS2. The arrows indicate temperatures of the structural phase transitions according to Ref. [11].
Figure 4
Figure 4
Electrical resistivity of Ag3CuS2. The arrows indicate temperatures at which the resistivity has peculiarities, these temperatures well correlate with the structural phase transitions according to Ref. [11]. The inset shows the evolution of the peculiarity near to 500 K with thermal cycling. The upward pointing arrows indicate the on-heating temperature of the transition, while the downward pointing arrows show the on-cooling transition temperature according to the resistivity data.
Figure 5
Figure 5
Temperature derivative of the resistivity of Ag3CuS2 on the second heating-cooling cycle. The large arrows indicate temperatures of the structural phase transitions according to Ref. [11]. The small downward pointing arrows indicate the on-heating temperature of the transition, while the upward pointing arrows show the on-cooling transition temperature according to the resistivity data.
Figure 6
Figure 6
Temperature dependencies of the Seebeck coefficient and of the resistivity of Ag3CuS2 sample on the fourth heating-cooling cycle. The inset shows the thermoelectric power factor S2/ρ.
Figure 7
Figure 7
The dependence of the lnρ(T) vs 1/T for Ag3CuS2 sample.
Figure 8
Figure 8
Band structure of Ag3CuS2 (I41/amd), calculated using generalized gradient PBE approximation. Energy is counted from the middle of the band gap ϵi. Special points in the Brillouin zone are denoted according to [23].
Figure 9
Figure 9
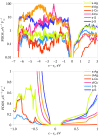
Atomic state projected density of electron states (PDOS) in Ag3CuS2 (I41/amd). Upper panel shows PDOS in logarithmic scale in the wide energy range, while lower panel shows PDOS around the band gap. Energy is counted from the middle of the band gap ϵi.
Figure 10
Figure 10
The dependence of the Seebeck coefficient (blue curve, left axis) and the Hall concentration (gray curve, right axis) on the chemical potential at 300 K. The vertical gray dashed lines show the boundaries of the band gap, and the green dash-dotted line shows the position of the chemical potential at equal concentrations of electrons and holes. Red (blue) dots on the Hall concentration plot show the concentrations of holes (electrons) separately. The chemical potential is counted from the middle of the band gap ϵi.
Figure 11
Figure 11
The density of states around the band gap of pure Ag3CuS2 and in the presence of Ag, Cu, and S vacancies with the atomic fraction x. The arrows show the positions of Fermi energy for Ag and Cu vacancies. Gray dotted curve shows DOS in the presence of Ag vacancy before atomic relaxation. Energy is counted from the middle of the band gap ϵi.
Figure 12
Figure 12
Phonon spectrum of Ag3CuS2 (I41/amd), calculated at zero temperature, using equilibrium lattice parameters and PBEsol density functional approximation [28].
Figure 13
Figure 13
Phonon spectrum of Ag3CuS2 (I41/amd) calculated at room temperature.
Figure 14
Figure 14
Total and atom-projected phonon density of states in Ag3CuS2 (I41/amd) calculated at room temperature.
Figure 15
Figure 15
Spectral (red curve) and cumulative (cyan curve) contributions of phonons into lattice thermal conductivity at 300 K as a functions of phonon frequency. Blue curve shows cumulative thermal conductivity as a function of phonon mean free path lp. Arrows are directed to the axes used for plotting corresponding curves.

References

    1. Slack G.A. New Materials and Performance Limits for Thermoelectric Cooling. CRC Press; Boca Raton, FL, USA: 1995. pp. 407–440. CRC Handbook of Thermoelectrics. Chapter 34.
    1. Liu H., Shi X., Xu F., Zhang L., Zhang W., Chen L., Li Q., Uher C., Day T., Snyder G.J. Copper ion liquid-like thermoelectrics. Nat. Mater. 2012;11:422–425. doi: 10.1038/nmat3273. - DOI - PubMed
    1. Yu B., Liu W., Chen S., Wang H., Wang H., Chen G., Ren Z. Thermoelectric properties of copper selenide with ordered selenium layer and disordered copper layer. Nano Energy. 2012;1:472–478. doi: 10.1016/j.nanoen.2012.02.010. - DOI
    1. Okimura H., Matsumae T., Makabe R. Electrical properties of Cu2-xSe thin films and their application for solar cells. Thin Solid Films. 1980;71:53–59. doi: 10.1016/0040-6090(80)90183-2. - DOI
    1. Mane R., Kajve S., Lokhande C., Han S.H. Studies on p-type copper (I) selenide crystalline thin films for hetero-junction solar cells. Vacuum. 2006;80:631–635. doi: 10.1016/j.vacuum.2005.08.021. - DOI

LinkOut - more resources