. 2023 Jan 29;28(3):1296.
doi: 10.3390/molecules28031296.

In Silico Targeting of Fascin Protein for Cancer Therapy: Benchmarking, Virtual Screening and Molecular Dynamics Approaches

Affiliations

In Silico Targeting of Fascin Protein for Cancer Therapy: Benchmarking, Virtual Screening and Molecular Dynamics Approaches

Heba H A Hassan et al. Molecules. .

Abstract

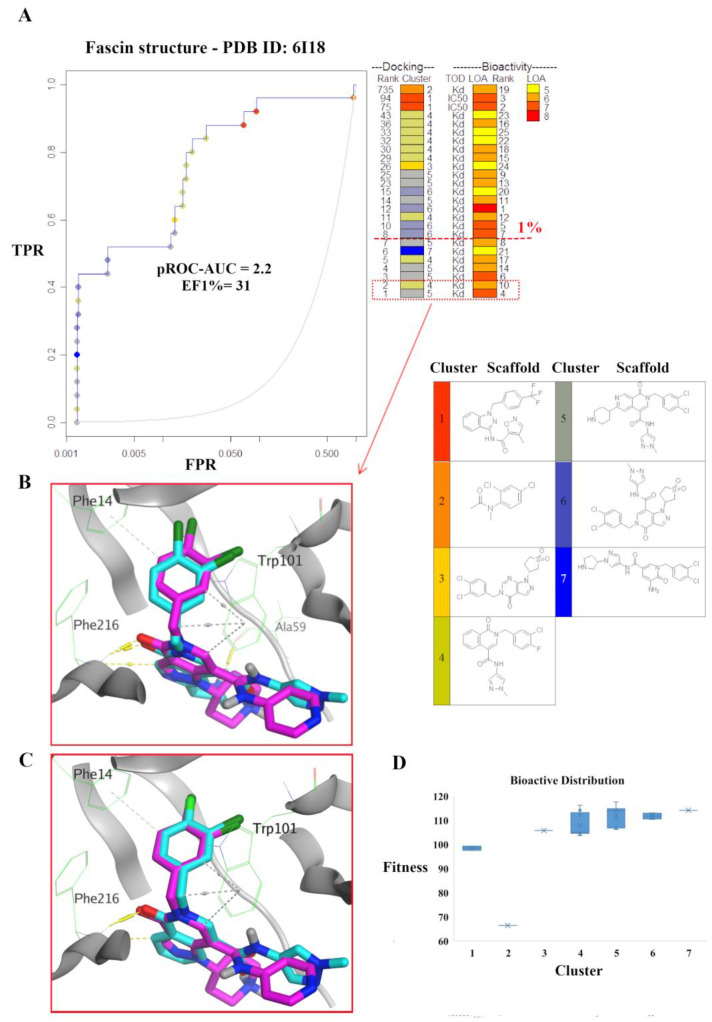
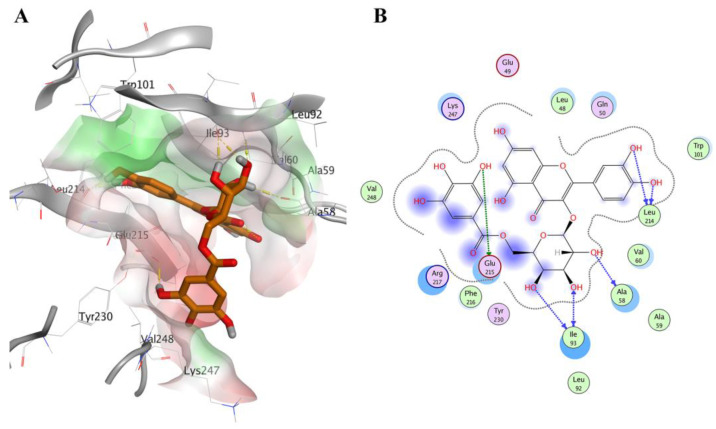
Fascin is an actin-bundling protein overexpressed in various invasive metastatic carcinomas through promoting cell migration and invasion. Therefore, blocking Fascin binding sites is considered a vital target for antimetastatic drugs. This inspired us to find new Fascin binding site blockers. First, we built an active compound set by collecting reported small molecules binding to Fascin's binding site 2. Consequently, a high-quality decoys set was generated employing DEKOIS 2.0 protocol to be applied in conducting the benchmarking analysis against the selected Fascin structures. Four docking programs, MOE, AutoDock Vina, VinaXB, and PLANTS were evaluated in the benchmarking study. All tools indicated better-than-random performance reflected by their pROC-AUC values against the Fascin crystal structure (PDB: ID 6I18). Interestingly, PLANTS exhibited the best screening performance and recognized potent actives at early enrichment. Accordingly, PLANTS was utilized in the prospective virtual screening effort for repurposing FDA-approved drugs (DrugBank database) and natural products (NANPDB). Further assessment via molecular dynamics simulations for 100 ns endorsed Remdesivir (DrugBank) and NANPDB3 (NANPDB) as potential binders to Fascin binding site 2. In conclusion, this study delivers a model for implementing a customized DEKOIS 2.0 benchmark set to enhance the VS success rate against new potential targets for cancer therapies.

Keywords: DEKOIS 2.0; Fascin; benchmarking; cancer; docking; virtual screening (VS).


Conflict of interest statement

The authors declare no conflict of interest.

Figures

Figure 1
Figure 1
(A) The structure of the Fascin-inhibitor complex (PDB ID: 6I18). The Fascin β-trefoil domains 1, 2, 3, and 4 are represented by red, magenta, yellow and green, respectively showing the three actin-binding sites. (B) Pose-retrieval docking experiments for the co-crystal ligand (cyan) (PDB: 6I18) using the four docking tools: MOE (magenta), Autodock Vina (green), VinaXB (orange), and PLANTS (blue).
Figure 2
Figure 2
pROC plots of benchmarking analysis displaying the screening performance against Fascin (PDB ID: 6I18) and Fascin (PDB ID: 6I0Z) for (A,B), respectively. The curves of the docking tools PLANTS, Autodock vina, VinaXB, and MOE are represented by blue, orange, green, and magenta lines, respectively, while the grey line indicates the random screening performance. The true-positive rate (TPR), y-axis, represents the detected bioactives fraction, while the false-positive rate (FPR), x-axis, is the decoys retrieved fraction from a score − ordered list of all decoys.
Figure 3
Figure 3
(A) pROC-Chemotype plot of the Fascin PDB ID: 6I18 using the PLANTS docking program. The docking data is coordinated with the cluster number and the bioactivity rank. The color scale of the bioactivity rank is from yellow (less potent) to red (more potent). A 1% bioactive enrichment is represented by the red-dashed line. (B,C) Docking poses of the best two ranked compounds overlaid on the co-crystal ligand (rank 12) as cyan and magenta sticks, respectively. (D) Bioactive molecules distribution is represented by a box plot of the fitness values vs. chemotype clusters.
Figure 4
Figure 4
Docking pose of Remdesivir (DrugBank cyan sticks) in the Fascin binding site 2 (PDB ID: 6I18), represented by 3D and 2D as (A,B), respectively. Polar and non-polar areas of the pocket are shown in red and green colored molecular surfaces, respectively. Yellow dashed lines show the ligand interactions. Non-polar hydrogen atoms are ignored for clarification.
Figure 5
Figure 5
Docking pose of compound CP3756 (NANPDB3—orange sticks) in the Fascin binding site 2 (PDB ID: 6I18), represented by 3D and 2D as (A,B), respectively. The color scheme is the same as in Figure 4.
Figure 6
Figure 6
(A) Radius of gyration (RoG) of the protein throughout the simulation time. (B) Root mean square deviation (RMSD) of the protein alpha carbons throughout the simulation. (C) Per residue root mean square fluctuation (RMSF) with the amino acid residues of the binding site are presented with a red background. The color scheme is represented as the following: (red: Remdesivir, orange: Lapatinib, yellow: Fexofenadine, purple: NANPDB1, blue: NANPDB2, cyan: NANPDB3, black: Holoprotein, and green: unliganded protein).
Figure 7
Figure 7
Ligand RMSD and hydrogen bond analysis. The graphs of Remdesivir, Lapatinib, and Fexofenadine are shown in red, orange, and yellow, respectively, while the graphs of NANPDB1, NANPDB2, NANPDB3, and Holoprotein are shown in purple, blue, cyan, and black, respectively.
Figure 8
Figure 8
The distance between the center of mass of the indicated ligand and residues of Fascin protein in the binding site under investigation during a 100 ns (100,000 ps) MD simulation.
Figure 9
Figure 9
The free energy landscape (FEL) of the simulated Fascin systems based on the principal component analysis. (A) Remdesivir − Fascin complex system. (B) NANPDB3 − Fascin complex system. (C) The co − crystal ligand − Fascin complex system. (D) The unliganded − Fascin system. The color bar represents the free energy value in kcal mol −1. The color ranges from red to yellow to blue spots indicate the energy minima and energetically favored protein conformations to more unfavorable high-energy conformations.
Figure 10
Figure 10
The minimum distance graph of both Remdesivir- and NANPDB3- Fascin interactions for (A,B), respectively, during the MD simulation. Snapshots at different simulation time are illustrated for both systems.

References

    1. Seyfried T.N., Huysentruyt L.C. On the origin of cancer metastasis. Crit. Rev. Oncog. 2013;18:43. doi: 10.1615/CritRevOncog.v18.i1-2.40. - DOI - PMC - PubMed
    1. Machesky L.M., Lia A. Fascin. Commun. Integr. Biol. 2010;3:263–270. doi: 10.4161/cib.3.3.11556. - DOI - PMC - PubMed
    1. Flemban A., Qualtrough D. The potential role of hedgehog signaling in the luminal/basal phenotype of breast epithelia and in breast cancer invasion and metastasis. Cancers. 2015;7:1863–1884. doi: 10.3390/cancers7030866. - DOI - PMC - PubMed
    1. Alqathama A. BRAF in malignant melanoma progression and metastasis: Potentials and challenges. Am. J. Cancer Res. 2020;10:1114. - PMC - PubMed
    1. Jayo A., Parsons M. Fascin: A key regulator of cytoskeletal dynamics. Int. J. Biochem. Cell Biol. 2010;42:1614–1617. doi: 10.1016/j.biocel.2010.06.019. - DOI - PubMed