Serum Nutritional Biomarkers and All-Cause and Cause-Specific Mortality in U.S. Adults with Metabolic Syndrome: The Results from National Health and Nutrition Examination Survey 2001-2006
- PMID: 36771258
- PMCID: PMC9918903
- DOI: 10.3390/nu15030553
Serum Nutritional Biomarkers and All-Cause and Cause-Specific Mortality in U.S. Adults with Metabolic Syndrome: The Results from National Health and Nutrition Examination Survey 2001-2006
Abstract
Background: There is limited research on the associations between serum nutritional biomarkers and mortality risk in patients with metabolic syndrome (MetS). Existing studies merely investigated the single-biomarker effect. Thus, this study aimed to investigate the combined effect of nutritional biomarker mixtures and mortality risk using the Bayesian kernel machine regression (BKMR) model in patients with MetS.
Methods: We included the MetS patients, defined according to the 2018 Guideline on the Management of Blood Cholesterol from the National Health and Nutrition Examination Survey (NHANES) 2001-2006. A total of 20 serum nutritional biomarkers were measured and evaluated in this study. The Cox proportional hazard model and restricted cubic spline models were used to evaluate the individual linear and non-linear association of 20 nutritional biomarkers with mortality risk. Bayesian kernel machine regression (BKMR) was used to assess the associations between mixture of nutritional biomarkers and mortality risk.
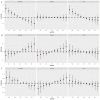
Results: A total of 1455 MetS patients had a median age of 50 years (range: 20-85). During a median of 17.1-year follow-up, 453 (24.72%) died: 146 (7.20%) caused by CVD and 87 (5.26%) by cancer. Non-linear and linear analyses indicated that, in total, eight individual biomarkers (α-carotene, β-carotene, bicarbonate, lutein/zeaxanthin, lycopene, potassium, protein, and vitamin A) were significantly associated with all-cause mortality (all p-values < 0.05). Results from BKMR showed an association between the low levels of the mixture of nutritional biomarkers and high risk of all-cause mortality with the estimated effects ranging from 0.04 to 0.14 (referent: medians). α-Carotene (PIP = 0.971) and potassium (PIP = 0.796) were the primary contributors to the combined effect of the biomarker mixture. The nutritional mixture levels were found to be negatively associated with the risk of cardiovascular disease (CVD) mortality and positively associated with the risk of cancer mortality. After it was stratified by nutrients, the mixture of vitamins showed a negative association with all-cause and CVD mortality, whereas the mixture of mineral-related biomarkers was positively associated with all-cause and cancer mortality.
Conclusion: Our findings support the evidence that nutritional status was associated with long-term health outcomes in MetS patients. It is necessary for MetS patients to be concerned with certain nutritional status (i.e., vitamins and mineral elements).
Keywords: Bayesian analysis; NHANES; biomarkers; carotenoid; metabolic syndrome; mortality; potassium.
Conflict of interest statement
The authors declare no conflict of interest.
Figures


Similar articles
-
Protective effect of serum carotenoids on mortality among metabolic syndrome patients: attenuated by lipid-lowering drugs.Nutr J. 2025 Feb 19;24(1):27. doi: 10.1186/s12937-025-01092-x. Nutr J. 2025. PMID: 39972496 Free PMC article.
-
Associations of individual and mixture exposure to volatile organic compounds with metabolic syndrome and its components among US adults.Chemosphere. 2024 Jan;347:140683. doi: 10.1016/j.chemosphere.2023.140683. Epub 2023 Nov 10. Chemosphere. 2024. PMID: 37952817
-
Biological aging mediates the associations of metabolic score for insulin resistance with all-cause and cardiovascular disease mortality among US adults: A nationwide cohort study.Diabetes Obes Metab. 2024 Sep;26(9):3552-3564. doi: 10.1111/dom.15694. Epub 2024 Jun 9. Diabetes Obes Metab. 2024. PMID: 38853301
-
The relationship of vitamin D status to risk of cardiovascular disease and mortality.Dan Med J. 2015 Feb;62(2):B5008. Dan Med J. 2015. PMID: 25634511 Review.
-
The association of aldehyde exposure with the risk of periodontitis: NHANES 2013-2014.Clin Oral Investig. 2023 Dec 26;28(1):29. doi: 10.1007/s00784-023-05451-y. Clin Oral Investig. 2023. PMID: 38147163 Review.
Cited by
-
Protective effect of serum carotenoids on mortality among metabolic syndrome patients: attenuated by lipid-lowering drugs.Nutr J. 2025 Feb 19;24(1):27. doi: 10.1186/s12937-025-01092-x. Nutr J. 2025. PMID: 39972496 Free PMC article.
-
The Colombo Twin and Singleton Study (COTASS): Piloting the Feasibility of Collecting Nutritional Data and Extension of the Sample to Include Children of Twins.Behav Genet. 2024 Jan;54(1):63-72. doi: 10.1007/s10519-023-10171-w. Epub 2024 Jan 7. Behav Genet. 2024. PMID: 38184818 Free PMC article.
-
Relationships between minerals' intake and blood homocysteine levels based on three machine learning methods: a large cross-sectional study.Nutr Diabetes. 2024 Jun 1;14(1):36. doi: 10.1038/s41387-024-00293-3. Nutr Diabetes. 2024. PMID: 38824142 Free PMC article.
-
Associations of multiple carotenoid co-exposure with all-cause and cause-specific mortality in US adults: a prospective cohort study.Front Nutr. 2024 Aug 7;11:1415537. doi: 10.3389/fnut.2024.1415537. eCollection 2024. Front Nutr. 2024. PMID: 39171107 Free PMC article.
-
Co-exposure to multiple vitamins and the risk of all-cause mortality in patients with diabetes.Front Endocrinol (Lausanne). 2023 Sep 19;14:1254133. doi: 10.3389/fendo.2023.1254133. eCollection 2023. Front Endocrinol (Lausanne). 2023. PMID: 37795357 Free PMC article.
References
-
- Song T., Eirin A., Zhu X., Zhao Y., Krier J.D., Tang H., Jordan K.L., Woollard J.R., Taner T., Lerman A., et al. Mesenchymal Stem Cell–Derived Extracellular Vesicles Induce Regulatory T Cells to Ameliorate Chronic Kidney Injury. Hypertension. 2020;75:1223–1232. doi: 10.1161/HYPERTENSIONAHA.119.14546. - DOI - PMC - PubMed
MeSH terms
Substances
Grants and funding
LinkOut - more resources
Full Text Sources
Medical

