

Multiple Trajectories of Body Mass Index and Waist Circumference and Their Associations with Hypertension and Blood Pressure in Chinese Adults from 1991 to 2018: A Prospective Study
- PMID: 36771457
- PMCID: PMC9919034
- DOI: 10.3390/nu15030751
Multiple Trajectories of Body Mass Index and Waist Circumference and Their Associations with Hypertension and Blood Pressure in Chinese Adults from 1991 to 2018: A Prospective Study
Abstract
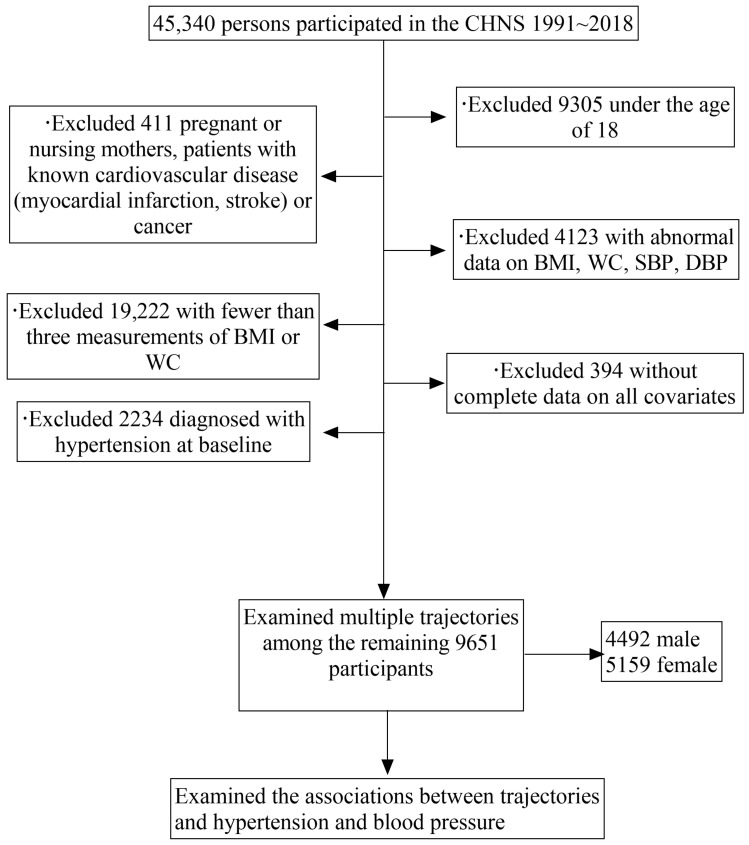
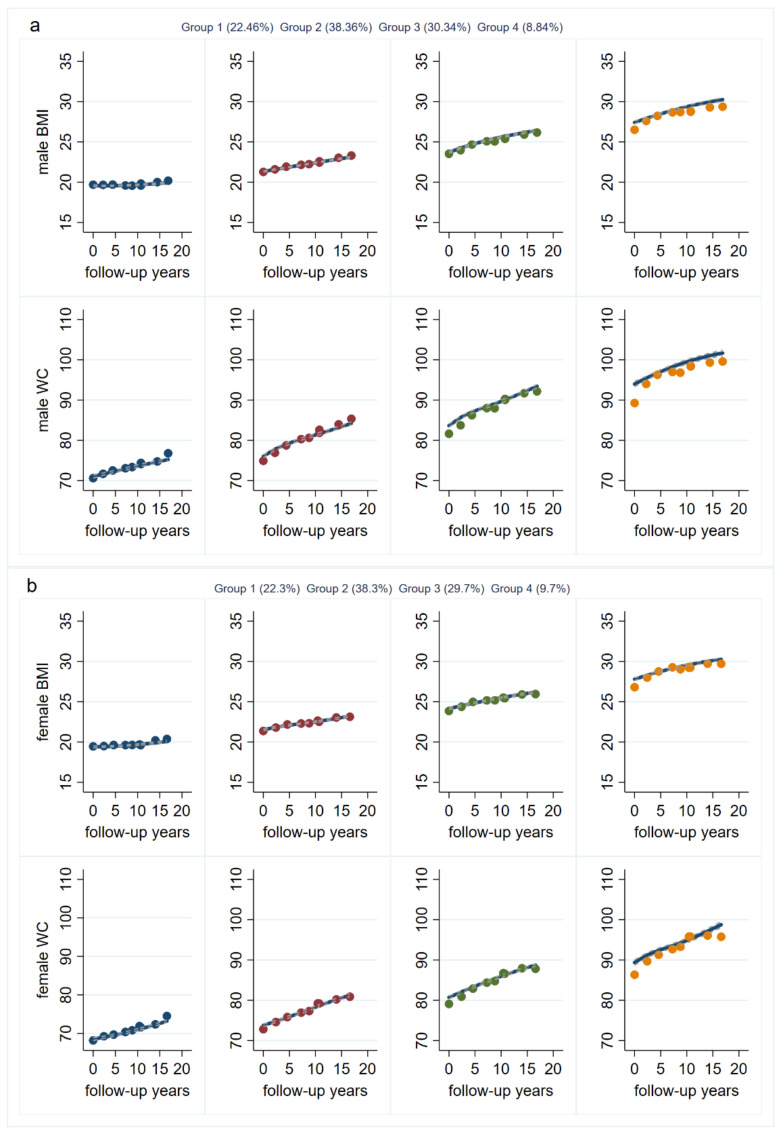
Body mass index (BMI) and waist circumference (WC) have been suggested to be involved in the etiology of hypertension. The present study aimed to determine multiple trajectories of BMI and WC, then examined their associations with the risks of hypertension and high blood pressure in Chinese adults. The study used China Health and Nutrition Survey data from 1991 to 2018. The sample included 9651 adults aged 18 years or older. We used group-based multi-trajectory modeling to identify trajectories. We estimated the relationships between the trajectories and the risks of hypertension with a Cox proportional hazards regression model and the trajectories' relationships with blood pressure levels with a generalized linear model. We identified four trajectories for each gender: low stable BMI, low increasing WC (group 1); medium increasing BMI, medium increasing WC (group 2); increasing BMI to overweight, increasing WC to central obesity (group 3), increasing BMI to obesity, increasing central obesity WC (group 4). Group 1 was the reference group. Among males in groups 2, 3, and 4, the adjusted hazard ratios (HR) and 95% confidence intervals (95% CI) of hypertension were 1.30 (1.15-1.48), 1.86 (1.58-2.18), and 2.60 (2.02-3.34), respectively. The systolic blood pressure (SBP) and diastolic blood pressure (DBP) of males in group 4 increased by 11.90 mm of mercury (mmHg) and 7.75 mmHg, respectively. Among females in groups 2, 3, and 4, the HR and 95% CI of hypertension were 1.35 (1.18-1.54), 1.92 (1.62-2.26), and 2.37 (1.85-3.03), respectively. The SBP and DBP of females in group 4 increased by 8.84 mmHg and 5.79 mmHg, respectively. These data indicated that increases in BMI and WC were associated with unfavorable hypertension risks. Attention to both BMI and WC trajectories has the potential to prevent hypertension.
Keywords: BMI; Chinese adults; WC; blood pressure; hypertension; multi-trajectory; prospective study.
Conflict of interest statement
The authors declare no conflict of interest.
Figures


Similar articles
-
Waist Circumference Trajectories in Relation to Blood Pressure and the Risk of Hypertension in Chinese Adults.Nutrients. 2022 Dec 9;14(24):5260. doi: 10.3390/nu14245260. Nutrients. 2022. PMID: 36558419 Free PMC article.
-
[Trajectories of body mass index and risk of hypertension and blood pressure among Chinese adults].Wei Sheng Yan Jiu. 2023 May;52(3):354-361. doi: 10.19813/j.cnki.weishengyanjiu.2023.03.002. Wei Sheng Yan Jiu. 2023. PMID: 37500512 Chinese.
-
Independent and Joint Associations of BMI and Waist Circumference With the Onset of Type 2 Diabetes Mellitus in Chinese Adults: Prospective Data Linkage Study.JMIR Public Health Surveill. 2023 Jan 11;9:e39459. doi: 10.2196/39459. JMIR Public Health Surveill. 2023. PMID: 36630180 Free PMC article.
-
Multi-trajectories of BMI, waist circumference, gut microbiota, and incident dyslipidemia: a 27-year prospective study.mSystems. 2025 May 20;10(5):e0024325. doi: 10.1128/msystems.00243-25. Epub 2025 Apr 28. mSystems. 2025. PMID: 40293249 Free PMC article.
-
Associations of general and central adiposity with hypertension and cardiovascular disease among South Asian populations: a systematic review and meta-analysis.BMJ Open. 2023 Dec 18;13(12):e074050. doi: 10.1136/bmjopen-2023-074050. BMJ Open. 2023. PMID: 38110373 Free PMC article.
Cited by
-
Association between inflammatory biomarkers and hypertension among sedentary adults in US: NHANES 2009-2018.J Clin Hypertens (Greenwich). 2024 Aug;26(8):945-954. doi: 10.1111/jch.14851. Epub 2024 Jun 30. J Clin Hypertens (Greenwich). 2024. PMID: 38946147 Free PMC article.
-
Multi-trajectories of body mass index, waist circumference, gut microbiota, and incident dyslipidemia: a 27-year prospective study.Res Sq [Preprint]. 2024 Apr 19:rs.3.rs-4251069. doi: 10.21203/rs.3.rs-4251069/v1. Res Sq. 2024. Update in: mSystems. 2025 May 20;10(5):e0024325. doi: 10.1128/msystems.00243-25. PMID: 38699314 Free PMC article. Updated. Preprint.
-
Association between obesity and fracture risk in Chinese women above 50 years of age: a prospective cohort study.BMC Public Health. 2024 Jan 2;24(1):28. doi: 10.1186/s12889-023-17494-7. BMC Public Health. 2024. PMID: 38167038 Free PMC article.
-
Predictive Capability of Dual Trajectories of Central Adiposity Indices Combined With Glucose for Cardiovascular Diseases.J Diabetes. 2025 Apr;17(4):e70081. doi: 10.1111/1753-0407.70081. J Diabetes. 2025. PMID: 40276925 Free PMC article.
-
Sex-specific associations between body mass index trajectories and risk of hypertension.BMC Pediatr. 2024 Oct 17;24(1):668. doi: 10.1186/s12887-024-05151-w. BMC Pediatr. 2024. PMID: 39420252 Free PMC article.
References
-
- The World Health Organization (WHO) Hypertension. 2021. [(accessed on 9 August 2022)]. Available online: https://www.who.int/news-room/fact-sheets/detail/hypertension.
-
- Acta Nutrimenta Sinica . Report on Nutrition and Chronic Diseases in China. Acta Nutrimenta Sinica; Beijing, China: 2020.
-
- Lu J., Lu Y., Wang X., Li X., Linderman G.C., Wu C., Cheng X., Mu L., Zhang H., Liu J., et al. Prevalence, awareness, treatment, and control of hypertension in China: Data from 1·7 million adults in a population-based screening study (China PEACE Million Persons Project) Lancet. 2017;390:2549–2558. doi: 10.1016/S0140-6736(17)32478-9. - DOI - PubMed
-
- Stanaway J.D., Afshin A., Gakidou S.L.S.E., Abate D., Abate K.H., Gakidou E. Global, regional, and national comparative risk assessment of 84 behavioural, environmental and occupational, and metabolic risks or clusters of risks for 195 countries and territories, 1990–2017: A systematic analysis for the Global Burden of Disease Study 2017. Lancet. 2018;392:1923–1994. - PMC - PubMed
MeSH terms
Grants and funding
LinkOut - more resources
Full Text Sources
Medical
