. 2023 Jan 17;12(3):419.
doi: 10.3390/plants12030419.

Genome-Wide Association Study of Rice Grain Shape and Chalkiness in a Worldwide Collection of Xian Accessions

Affiliations

Genome-Wide Association Study of Rice Grain Shape and Chalkiness in a Worldwide Collection of Xian Accessions

Nansheng Wang et al. Plants (Basel). .

Abstract

Rice (Oryza sativa L.) appearance quality, which is mainly defined by grain shape and chalkiness, is an important target in rice breeding. In this study, we first re-sequenced 137 indica accessions and then conducted a genome-wide association study (GWAS) for six agronomic traits with the 2,998,034 derived single nucleotide polymorphisms (SNPs) by using the best linear unbiased prediction (BLUP) values for each trait. The results revealed that 195 SNPs had significant associations with the six agronomic traits. Based on the genome-wide linkage disequilibrium (LD) blocks, candidate genes for the target traits were detected within 100 kb upstream and downstream of the relevant SNP loci. Results indicate that six quantitative trait loci (QTLs) significantly associated with six traits (qTGW4.1, qTGW4.2, qGL4.1, qGL12.1, qGL12.2, qGW2.1, qGW4.1, qGW6.1, qGW8.1, qGW8.2, qGW9.1, qGW11.1, qGLWR2.1, qGLWR2.2, qGLWR4.2, qPGWC5.1 and qDEC6.1) were identified for haplotype analysis. Among these QTLs, two (qTGW4.2 and qGW6.1), were overlapped with FLO19 and OsbZIP47, respectively, and the remaining four were novel QTLs. These candidate genes were further validated by haplotype block construction.

Keywords: GWAS; QTLs; chalkiness; grain shape; rice.


Conflict of interest statement

The authors declare no conflict of interest.

Figures

Figure 1
Figure 1
Box plots of six rice grain appearance and milling quality traits in three environments and phenotypic correlations of six traits in different environments. HN, Hainan; GX, Guangxi; JX, Jiangxi; (a) thousand grain weight; (b) grain length; (c) grain width; (d) grain length to width ratio; (e) percentage of grains with chalkiness; (f) degree of endosperm with chalkiness; (g) Hainan; (h) Guangxi; (i) Jiangxi; ‘*’, ‘**’, and ‘***’ refer to significant correlations (p < 0.05, p < 0.01, and p < 0.001).
Figure 2
Figure 2
Genetic evolution of natural populations of indica rice. (a) Phylogenetic tree; each branch is a rice accession. (b) Principal component analysis on 2.89 million SNPs of 137 rice accessions. PC1 and PC2 refer to the first and second principal components, respectively. The numbers in parentheses refer to the proportion of variance explained by the corresponding axes. Red points represent the 137 rice accessions, with each point representing one rice accession. A shorter distance between the points indicates a closer relationship. (c) Cluster analysis results of population genotypes, in which each color represents a group and each row indicates a group value. (d) Cross validation error rate for each k value. Among them, K is the lowest when k is 4.
Figure 3
Figure 3
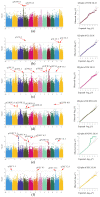
Genome-wide association plots of TGW, GL, GW, GLWR, PGWC and DEC in rice population plotted using the generalized linear model. The Manhattan map of genome-wide scans shows the −log10(p) values corresponding to the location of each of 12 chromosomes. Red solid lines represent the whole genome significant threshold p = 3.9 × 10⁻⁶. Red arrows indicate QTLs qTGW4.1(rs4_608507), qTGW4.2(rs4_1225773), qGL4.1(rs4_16205291), qGL12.1(rs12_225117), qGL12.2(rs12_1188996), qGW2.1(rs2_26502715), qGW4.1(rs4_502118), qGW6.1(rs6_8695272), qGW8.1(rs8_19551373), qGW8.2(rs8_28472120), qGW9.1(rs9_13050866), qGW11.1(rs11_8695392), qGLWR2.1(rs2_26502715), qGLWR2.2(rs2_35438743), qGLWR4.1(rs4_18391272), qGLWR4.2(rs4_29199879), qGLWR10.1(rs10_24820313), qPGWC3.1(rs3_5812574), qPGWC4.1(rs4_20153796), qPGWC5.1(rs5_267911), qPGWC5.2(rs5_14313526), qPGWC9.1(rs9_12763755), qPGWC11.1(rs11_23382869), qDEC1.1(rs1_42431688), qDEC6.1(rs6_27376022), qDEC11.1(rs11_7169791) and qDEC12.1(rs12_17698258) colocalized by GLM. The horizontal axis in the quantile–quantile (QQ) plot represents the expected value of the −log10 transformation, whereas the vertical axis indicates the observed value of the −log10 transformation. Manhattan plot and QQ plot of TGW (a), GL (b), GW (c), GLWR (d), PGWC (e) and DEC (f) in GLM.
Figure 4
Figure 4
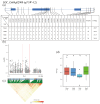
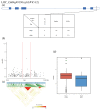
Identification of candidate genes for TGW. (a) Based on 26 SNPs in all evaluated rice accessions, four haplotypes of LOC_Os04g02900 were identified. In the gene structure diagram of LOC_Os04g02900 (http://rice.plantbiology.msu.edu, accessed on 15 May 2022), the promoter is indicated by white frame; the exon is represented by blue frame; and the intron and intergenic region are marked by blue lines. A thin black line represents the genomic location of each SNP. Haplotypes with fewer than 10 accessions are not shown. TGW (b) based on single polymorphism and LD heat map of local Manhattan map (c), around the peak on chromosome 4. Red dotted lines represent candidate regions for associated SNPs. Based on TGW (d) of LOC_Os04g02900 haplotype, differences between haplotypes were statistically analyzed using Tukey’s test.
Figure 5
Figure 5
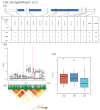
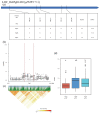
Identification of candidate genes for GL. (a) Based on 12 SNPs in all evaluated rice accessions, three haplotypes of LOC_Os12g03040 were identified. In the gene structure diagram of LOC_Os12g03040, the promoter is indicated by white frame; the exon is represented by blue frame; and the intron and intergenic region are marked by blue lines. A thin black line represents the genomic location of each SNP. Haplotypes with fewer than 10 accessions are not shown. GL (b) based on single polymorphism and LD heat map of local Manhattan map (c), around the peak on chromosome 12. Red dotted lines represent candidate regions for associated SNPs. Based on GL (d) of LOC_Os12g03040 haplotype, differences between haplotypes were statistically analyzed using Tukey’s test.
Figure 6
Figure 6
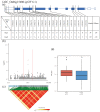
Identification of candidate genes for GW. (a) Based on 21 SNPs in all evaluated rice accessions, two haplotypes of LOC_Os06g15480 were identified. In the gene structure diagram of LOC_Os06g15480, the promoter is indicated by white frame; the exon is represented by blue frame; and the intron and intergenic region are marked by blue lines. A thin black line represents the genomic location of each SNP. Haplotypes with fewer than 10 accessions are not shown. GW (b) based on single polymorphism and LD heat map of local Manhattan map (c), around the peak on chromosome 6. Red dotted lines represent candidate regions for associated SNPs. Based on GW (d) of LOC_Os06g15480 haplotype, differences between haplotypes were statistically analyzed using Tukey’s test.
Figure 7
Figure 7
Identification of candidate genes for GLWR. (a) Based on one SNP in all evaluated rice accessions, two haplotypes of LOC_Os04g49130 were identified. In the gene structure diagram of LOC_Os04g49130, the promoter is indicated by white frame; the exon is represented by blue frame; and the intron and intergenic region are marked by blue lines. A thin black line represents the genomic location of each SNP. Haplotypes with fewer than 10 accessions are not shown. GLWR (b) based on single polymorphism and LD heat map of local Manhattan map (c), around the peak on chromosome 4. Red dotted lines represent candidate regions for associated SNPs. Based on GLWR (d) of LOC_Os04g49130 haplotype, differences between haplotypes were statistically analyzed using Tukey’s test.
Figure 8
Figure 8
Identification of candidate genes for PGWC. (a) Based on five SNPs in all evaluated rice accessions, three haplotypes of LOC_Os05g01430 were identified. In the gene structure diagram of LOC_Os05g01430, the exon is represented by blue frame. A thin black line represents the genomic location of each SNP. Haplotypes with fewer than 10 accessions are not shown. PGWC (b) based on single polymorphism and LD heat map of local Manhattan map (c), around the peak on chromosome 5. Red dotted lines represent candidate regions for associated SNPs. Based on PGWC (d) of LOC_Os05g01430 haplotype, differences between haplotypes were statistically analyzed using Tukey’s test.
Figure 9
Figure 9
Identification of candidate genes for DEC. (a) Based on 16 SNPs in all evaluated rice accessions, three haplotypes of LOC_Os06g45300 were identified. In the gene structure diagram of LOC_Os06g45300, the promoter is indicated by white frame; the exon is represented by blue frame; and the intron and intergenic region are marked by blue lines. A thin black line represents the genomic location of each SNP. Haplotypes with fewer than 10 accessions are not shown. DEC (b) based on single polymorphism and LD heat map of local Manhattan map (c), around the peak on chromosome 6. Red dotted lines represent candidate regions for associated SNPs. Based on DEC (d) of LOC_Os06g45300 haplotype, differences between haplotypes were statistically analyzed using Tukey’s test.

Similar articles

Cited by

References

    1. Chen W., Gao Y., Xie W., Gong L., Lu K., Wang W., Li Y., Liu X., Zhang H., Dong H., et al. Genome-wide association analyses provide genetic and biochemical insights into natural variation in rice metabolism. Sci. Found. China. 2014;46:714–721. doi: 10.1038/ng.3007. - DOI - PubMed
    1. Gong L., Chen W., Gao Y., Liu X., Zhang H., Xu C., Yu S., Zhang Q., Luo J. Genetic analysis of the metabolome exemplified using a rice population. Proc. Natl. Acad. Sci. USA. 2013;110:20320–20325. doi: 10.1073/pnas.1319681110. - DOI - PMC - PubMed
    1. Fao R.I.E. Increasing Crop Production Sustainably: The Perspective of Biological of Processes. Food and Agriculture Organization; Rome, Italy: 2009.
    1. Godfray H.C.J. The challenge of feeding 9-10 billion people equitably and sustainably. J. Agric. Sci. 2014;152:S2–S8. doi: 10.1017/S0021859613000774. - DOI
    1. Seck P.A., Diagne A., Mohanty S., Wopereis M. Crops that feed the world 7: Rice. Food Secur. 2012;4:7–24. doi: 10.1007/s12571-012-0168-1. - DOI