. 2023 Jan 17;12(3):435.
doi: 10.3390/plants12030435.

MtCLE08, MtCLE16, and MtCLE18 Transcription Patterns and Their Possible Functions in the Embryogenic Calli of Medicago truncatula

Affiliations

MtCLE08, MtCLE16, and MtCLE18 Transcription Patterns and Their Possible Functions in the Embryogenic Calli of Medicago truncatula

Andrei A Kudriashov et al. Plants (Basel). .

Abstract

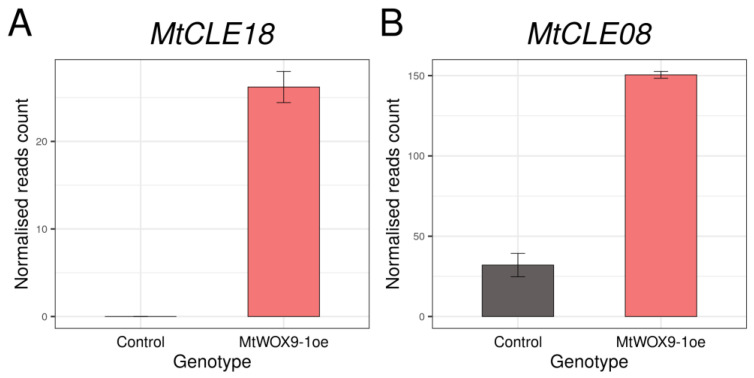
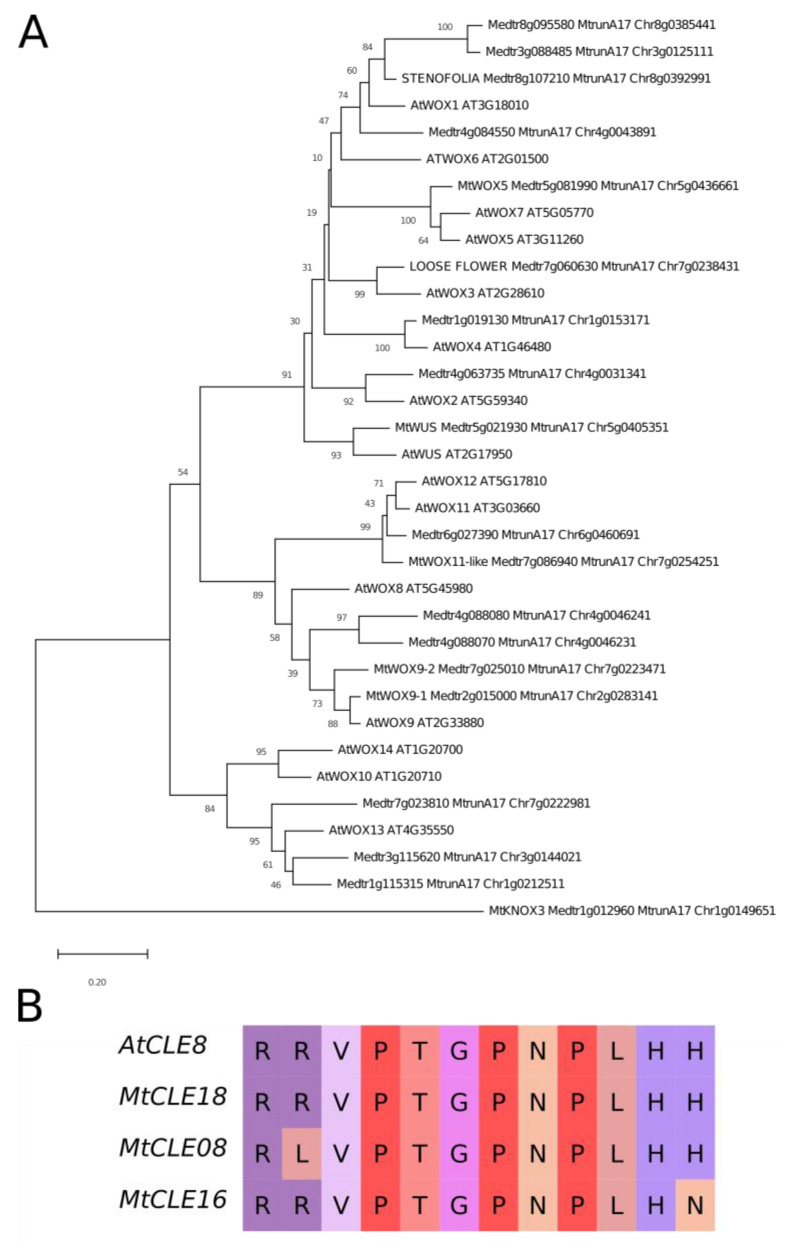
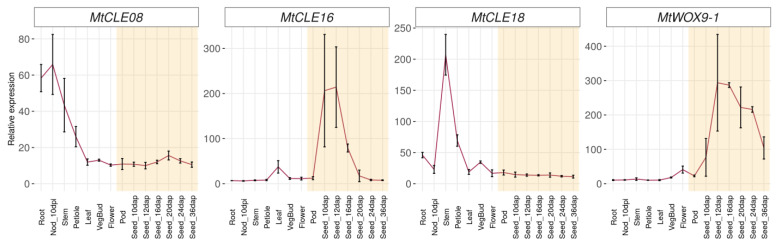
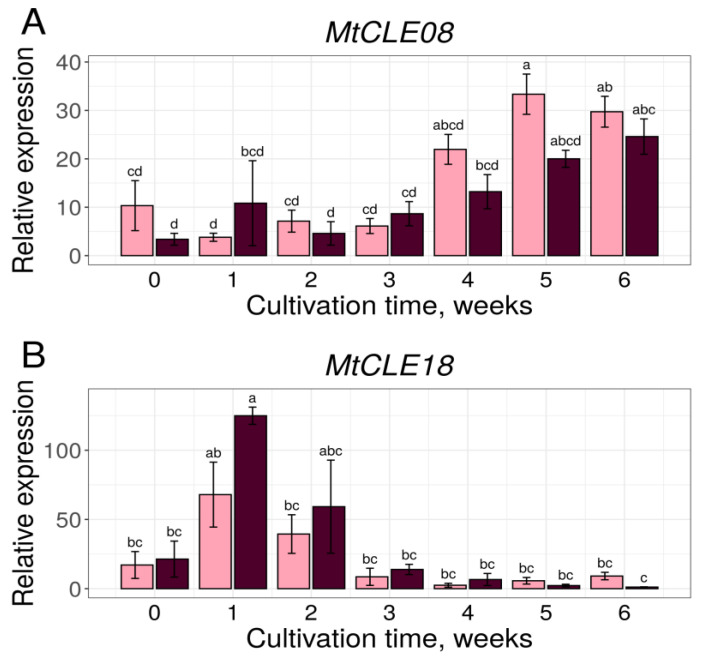
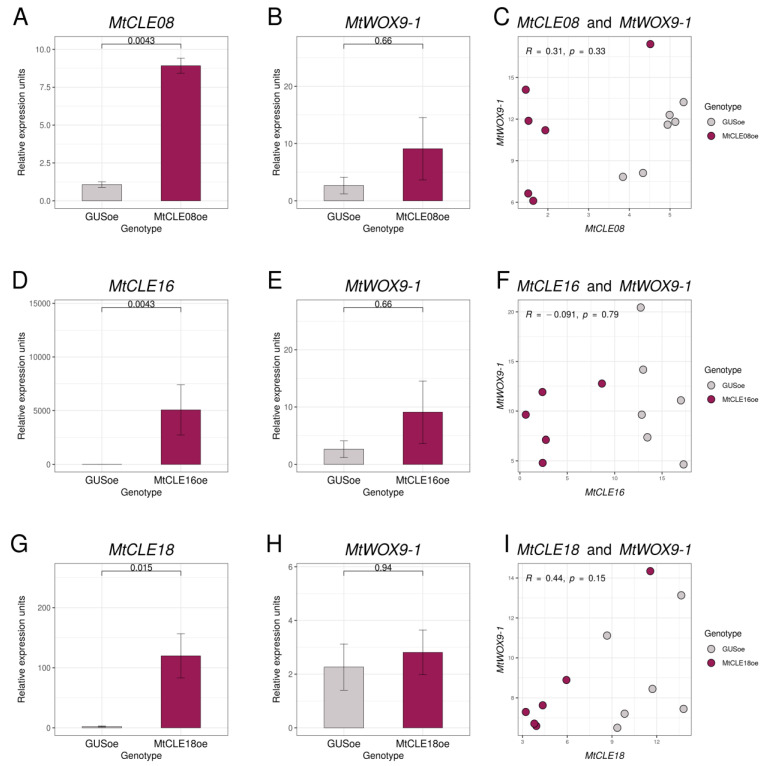
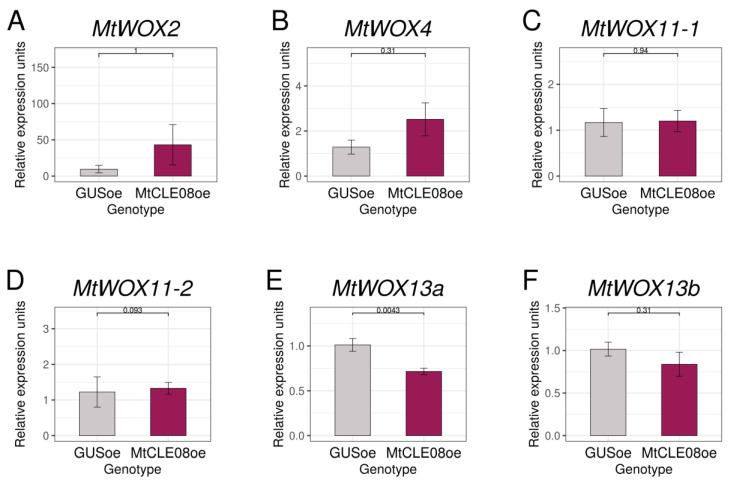
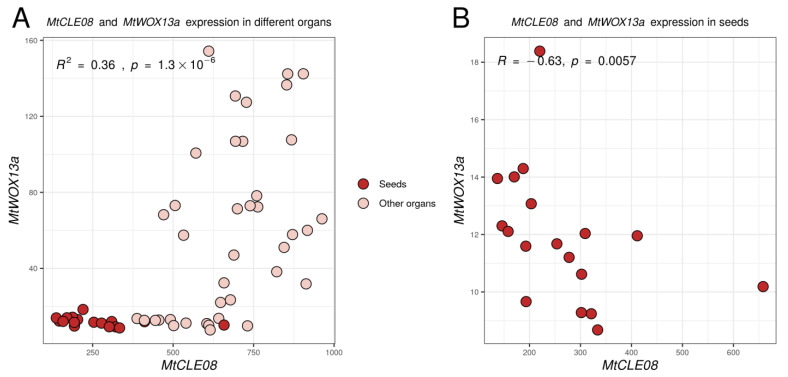
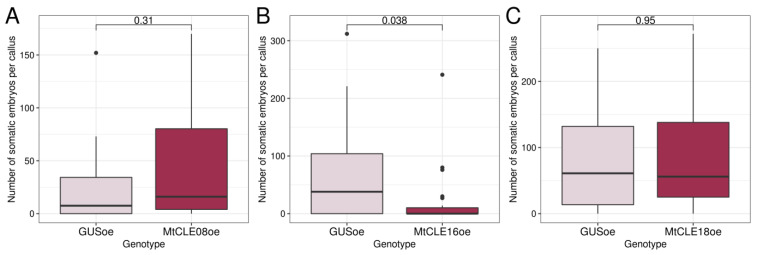
CLE peptides are well-known hormonal regulators of plant development, but their role in somatic embryogenesis remains undetermined. CLE genes are often regulated by WOX transcription factors and, in their turn, regulate the expression level of WOX genes. In this study, we used in vitro cultivation, as well as qPCR and transcriptomic analysis, to find CLE peptides which could regulate the MtWOX9-1 gene, stimulating somatic embryogenesis in Medicago truncatula. Three CLE peptides were found which could probably be such regulators, but none of them was found to influence MtWOX9-1 expression in the embryogenic calli. Nevertheless, overexpression of one of CLE genes under study, MtCLE16, decreased somatic embryogenesis intensity. Additionally, overexpression of MtCLE08 was found to suppress expression of MtWOX13a, a supposed antagonist of somatic embryo development. Our findings can be helpful for the search for new regeneration regulators which could be used for plant transformation.

Keywords: CLE peptides; Medicago truncatula; plant regeneration; somatic embryogenesis.


Conflict of interest statement

The authors declare no conflict of interest. The funders had no role in the design of the study; in the collection, analyses, or interpretation of data; in the writing of the manuscript; or in the decision to publish the results.

Figures

Figure 1
Figure 1
Expression levels of MtCLE18 (A) and MtCLE08 (B) in control (R108) calli and calli with MtWOX9-1 overexpression according to the transcriptomic analysis [17]. Error bars represent the standard error for two biological replicates.
Figure 2
Figure 2
(A) Phylogenetic tree of A. thaliana and M. truncatula WOX proteins, based on homeodomain sequences. The tree was inferred using the Neighbor-Joining method [18]. The percentages of replicate trees in which the associated proteins are clustered together in the bootstrap test (500 replicates) are shown next to the branches [19]. The tree is drawn to scale, with branch lengths in the same units as those of the evolutionary distances used to infer the phylogenetic tree. Evolutionary analyses were conducted in MEGA X [20]; (B) Alignment of CLE domains of A. thaliana CLE8 peptide and M. truncatula MtCLE18, 08 and 16 peptides. Different colors represent different amino acids.
Figure 3
Figure 3
Expression patterns of MtCLE08, MtCLE16, MtCLE18 and MtWOX9-1 genes in different organs and during different stages of seed development according to the Medicago truncatula Gene Expression Atlas [21]. The error bars represent SD of three biological replicates. Stages of seed development are highlighted in yellow.
Figure 4
Figure 4
MtCLE08 (A) and MtCLE18 (B) genes expression dynamics during in vitro cultivation of explants of embryogenic 2HA (pink) and non-embryogenic A17 (dark-red) lines. Error bars represent the standard error. Data are obtained from three biological replicates. To assess the statistical significance of the observed differences, one-way analysis of variance (one-way ANOVA) with Tukey’s post hoc test was used, with confidence level 0.95. Different lowercase letters represent expression levels with statistically significant differences (p-value < 0.05).
Figure 5
Figure 5
Expression levels of MtCLE08 (A), MtCLE16 (D), MtCLE18 (G), and MtWOX9-1 (B,E,H) genes in transgenic calli with GUS and MtCLE08 (A,B), MtCLE16 (D,E), or MtCLE18 (F,G) overexpression. Expression levels of the MtCLE08 (C), MtCLE16 (F), or MtCLE18 (I) gene and the MtWOX9-1 gene in individual callus samples. Error bars represent the standard error. Data are obtained from six biological repeats per genotype. To assess the statistical significance of the observed differences between different genotypes of calli, the Wilcoxon signed-rank test was used. To assess the statistical significance of correlation between expression levels of different genes, Spearman’s rank correlation test was used. Material for gene expression analysis in T0 calli was taken at 43rd–56th day after transformation, after 33–50 days of cultivation on the callus induction medium, and 7–14 days of cultivation on the hormone-free medium.
Figure 6
Figure 6
Expression levels of the MtWOX2 (A), MtWOX4 (B), MtWOX11-1 (C), MtWOX11-2 (D), MtWOX13a (E) and MtWOX13b (F) genes in transgenic calli with GUS and MtCLE08 overexpression. Error bars represent the standard error. Data are obtained from 6 biological repeats per genotype. To assess the statistical significance of the observed differences between different genotypes of calli, the Wilcoxon signed-rank test was used. Material for gene expression analysis in T0 calli was taken at 43rd–56th day after transformation, after 33–50 days of cultivation on the callus induction medium and 7–14 days of cultivation on the hormone-free medium.
Figure 7
Figure 7
Expression levels of the MtWOX13a and MtCLE08 genes in different organs and during different stages of seed development according to the Medicago truncatula Gene Expression Atlas [21]. To assess the statistical significance of correlation between expression levels of different genes, Spearman’s rank correlation test was used.
Figure 8
Figure 8
Number of somatic embryos per callus in transgenic calli with GUS and MtCLE08 (A), MtCLE16 (B), or MtCLE18 (C) overexpression. Data are obtained from 10–24 calli for different samples. For MtCLE16 overexpressing calli, two experiments were performed with similar results. To assess the statistical significance of the observed differences, the Wilcoxon signed-rank test was used. Analysis of M. truncatula SE capacity and weight measurement of T0 calli were performed on the 72nd–86th day after transformation, after 33–50 days of cultivation on the callus induction medium and 30–43 days of cultivation on the hormone-free medium.

Similar articles

Cited by

References

    1. Fletcher J.C. Recent Advances in Arabidopsis CLE Peptide Signaling. Trends Plant Sci. 2020;25:1005–1016. doi: 10.1016/j.tplants.2020.04.014. - DOI - PubMed
    1. Willoughby A.C., Nimchuk Z.L. WOX Going on: CLE Peptides in Plant Development. Curr. Opin. Plant Biol. 2021;63:102056. doi: 10.1016/j.pbi.2021.102056. - DOI - PMC - PubMed
    1. Hastwell A.H., de Bang T.C., Gresshoff P.M., Ferguson B.J. CLE Peptide-Encoding Gene Families in Medicago Truncatula and Lotus Japonicus, Compared with Those of Soybean, Common Bean and Arabidopsis. Sci. Rep. 2017;7:9384. doi: 10.1038/s41598-017-09296-w. - DOI - PMC - PubMed
    1. Song X.-F., Hou X.-L., Liu C.-M. CLE Peptides: Critical Regulators for Stem Cell Maintenance in Plants. Planta. 2021;255:5. doi: 10.1007/s00425-021-03791-1. - DOI - PubMed
    1. Leibfried A., To J.P.C., Busch W., Stehling S., Kehle A., Demar M., Kieber J.J., Lohmann J.U. WUSCHEL Controls Meristem Function by Direct Regulation of Cytokinin-Inducible Response Regulators. Nature. 2005;438:1172–1175. doi: 10.1038/nature04270. - DOI - PubMed

LinkOut - more resources