

Evaluation of a Sugarcane (Saccharum spp.) Hybrid F1 Population Phenotypic Diversity and Construction of a Rapid Sucrose Yield Estimation Model for Breeding
- PMID: 36771730
- PMCID: PMC9919227
- DOI: 10.3390/plants12030647
Evaluation of a Sugarcane (Saccharum spp.) Hybrid F1 Population Phenotypic Diversity and Construction of a Rapid Sucrose Yield Estimation Model for Breeding
Abstract
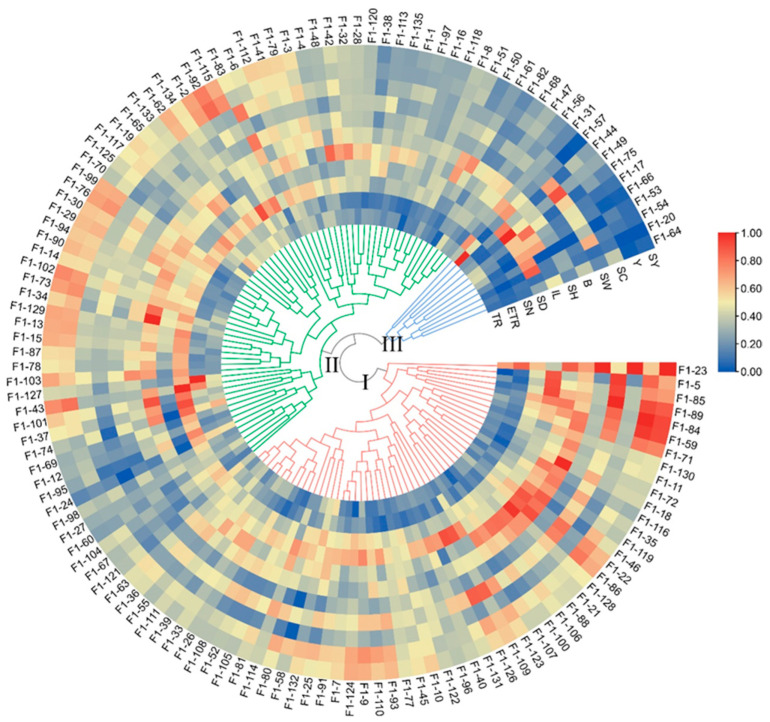
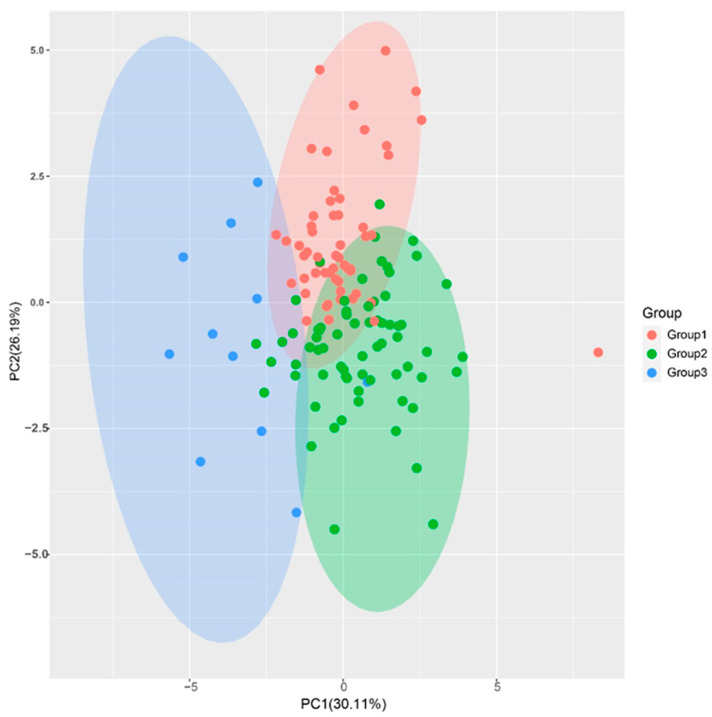
Sugarcane is the major sugar-producing crop worldwide, and hybrid F1 populations are the primary populations used in breeding. Challenged by the sugarcane genome's complexity and the sucrose yield's quantitative nature, phenotypic selection is still the most commonly used approach for high-sucrose yield sugarcane breeding. In this study, a hybrid F1 population containing 135 hybrids was constructed and evaluated for 11 traits (sucrose yield (SY) and its related traits) in a randomized complete-block design during two consecutive growing seasons. The results revealed that all the traits exhibited distinct variation, with the coefficient of variation (CV) ranging from 0.09 to 0.35, the Shannon-Wiener diversity index (H') ranging between 2.64 and 2.98, and the broad-sense heritability ranging from 0.75 to 0.84. Correlation analysis revealed complex correlations between the traits, with 30 trait pairs being significantly correlated. Eight traits, including stalk number (SN), stalk diameter (SD), internode length (IL), stalk height (SH), stalk weight (SW), Brix (B), sucrose content (SC), and yield (Y), were significantly positively correlated with sucrose yield (SY). Cluster analysis based on the 11 traits divided the 135 F1 hybrids into three groups, with 55 hybrids in Group I, 69 hybrids in Group II, and 11 hybrids in Group III. The principal component analysis indicated that the values of the first four major components' vectors were greater than 1 and the cumulative contribution rate reached 80.93%. Based on the main component values of all samples, 24 F1 genotypes had greater values than the high-yielding parent 'ROC22' and were selected for the next breeding stage. A rapid sucrose yield estimation equation was established using four easily measured sucrose yield-related traits through multivariable linear stepwise regression. The model was subsequently confirmed using 26 sugarcane cultivars and 24 F1 hybrids. This study concludes that the sugarcane F1 population holds great genetic diversity in sucrose yield-related traits. The sucrose yield estimation model, ySY=2.01xSN+8.32xSD+0.79xB+3.44xSH-47.64, can aid to breed sugarcane varieties with high sucrose yield.
Keywords: F1 population; phenotypic diversity; sucrose yield estimated model; sugarcane.
Conflict of interest statement
The authors declare no conflict of interest.
Figures


References
-
- Zhang B.Q., Huang Y.X., Zhou Z.F., Zhou S., Duan W.X., Yang C.F., Gao Y.J., Zhang G.M., Song X.P., Zhang X.Q., et al. Cold-Induced physiological and biochemical alternations and proteomic insight into the response of Saccharum spontaneum to low temperature. Int. J. Mol. Sci. 2022;23:14244. doi: 10.3390/ijms232214244. - DOI - PMC - PubMed
-
- National Bureau of Statistics. [(accessed on 10 October 2022)]; Available online: https://data.stats.gov.cn/
-
- Zhang M., Govindaraju M. Sugarcane production in China. In: De Oliveira A., editor. Sugarcane—Technology and Research. IntechOpen; London, UK: 2018. pp. 49–67. - DOI
Grants and funding
- 320MS113/Hainan Provincial Natural Science Foundation of China
- 321QN348/Hainan Provincial Natural Science Foundation of China
- no number/Operating expenses of Experiment and Demonstration Base of Sugar and Energy Dual Use New Sugarcane Varieties of Chinese Academy of Tropical Agricultural Sciences (2023)
LinkOut - more resources
Full Text Sources
Miscellaneous
