

Confinement-Induced Fractionation and Liquid-Liquid Phase Separation of Polymer Mixtures
- PMID: 36771812
- PMCID: PMC9921168
- DOI: 10.3390/polym15030511
Confinement-Induced Fractionation and Liquid-Liquid Phase Separation of Polymer Mixtures
Abstract
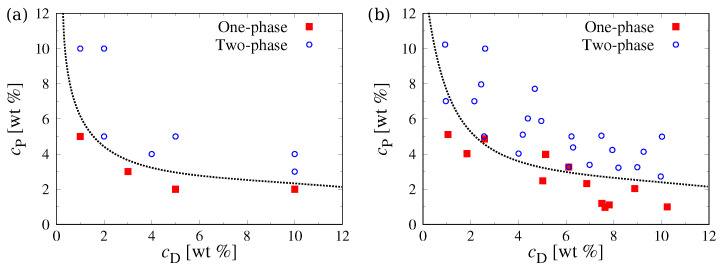
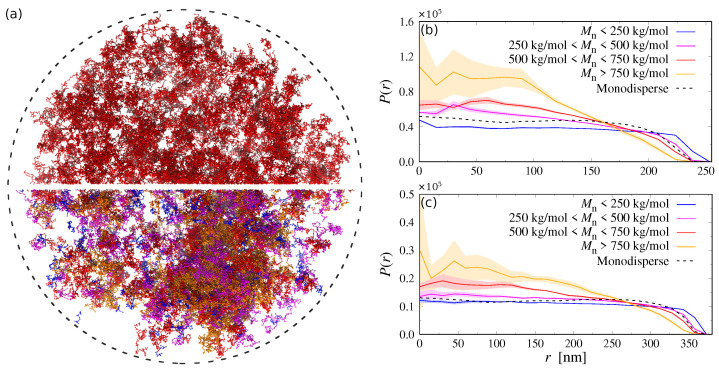
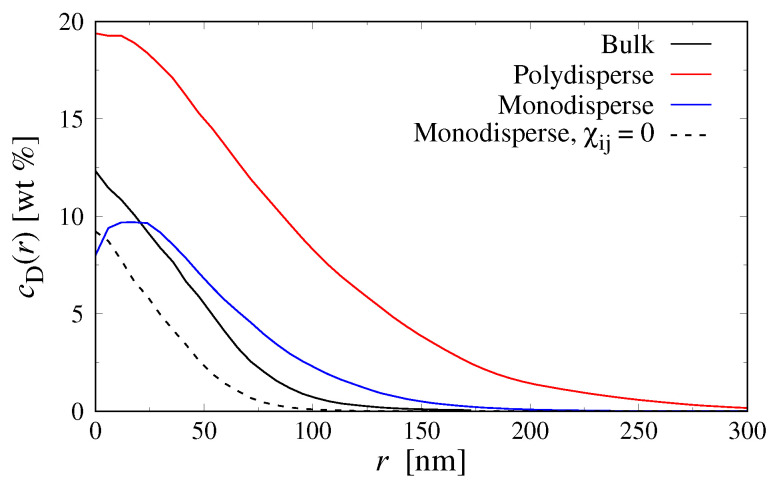
The formation of (bio)molecular condensates via liquid-liquid phase separation in cells has received increasing attention, as these aggregates play important functional and regulatory roles within biological systems. However, the majority of studies focused on the behavior of pure systems in bulk solutions, thus neglecting confinement effects and the interplay between the numerous molecules present in cells. To better understand the physical mechanisms driving condensation in cellular environments, we perform molecular simulations of binary polymer mixtures in spherical droplets, considering both monodisperse and polydisperse molecular weight distributions for the longer polymer species. We find that confinement induces a spatial separation of the polymers by length, with the longer ones moving to the droplet center. This partitioning causes a distinct increase in the local polymer concentration near the droplet center, which is more pronounced in polydisperse systems. Consequently, the confined systems exhibit liquid-liquid phase separation at average polymer concentrations where bulk systems are still in the one-phase regime.
Keywords: Dextran; PEG; confinement; droplet; molecular simulation; phase separation; polymer mixture; protocell.
Conflict of interest statement
The authors declare no conflict of interest.
Figures


Similar articles
-
Cell-Sized Confinements Alter Molecular Diffusion in Concentrated Polymer Solutions Due to Length-Dependent Wetting of Polymers.ACS Mater Au. 2023 May 16;3(5):442-449. doi: 10.1021/acsmaterialsau.3c00018. eCollection 2023 Sep 13. ACS Mater Au. 2023. PMID: 38089102 Free PMC article.
-
Impact of Polydispersity on Phase Separation: Insights from Polyethylene Glycol and Dextran Mixtures.J Phys Chem B. 2025 Mar 27;129(12):3263-3271. doi: 10.1021/acs.jpcb.4c08640. Epub 2025 Mar 13. J Phys Chem B. 2025. PMID: 40080692
-
Long term phase separation dynamics in liquid crystal-enriched microdroplets obtained from binary fluid mixtures.Soft Matter. 2023 Feb 1;19(5):1017-1024. doi: 10.1039/d2sm01348g. Soft Matter. 2023. PMID: 36647716
-
Confinement effects on phase behavior of soft matter systems.Soft Matter. 2008 Jul 16;4(8):1555-1568. doi: 10.1039/b802207k. Soft Matter. 2008. PMID: 32907146 Review.
-
Aqueous two-phase systems for protein separation: a perspective.J Chromatogr A. 2011 Dec 9;1218(49):8826-35. doi: 10.1016/j.chroma.2011.06.051. Epub 2011 Jun 21. J Chromatogr A. 2011. PMID: 21752387 Review.
Cited by
-
Cell-Sized Confinements Alter Molecular Diffusion in Concentrated Polymer Solutions Due to Length-Dependent Wetting of Polymers.ACS Mater Au. 2023 May 16;3(5):442-449. doi: 10.1021/acsmaterialsau.3c00018. eCollection 2023 Sep 13. ACS Mater Au. 2023. PMID: 38089102 Free PMC article.
References
-
- Matha S., Qi S., Barz M., Schmid F. How ill-defined constituents produce well-defined nanoparticles: Effect of polymer dispersity on the uniformity of copolymeric micelles. Phys. Rev. Materials. 2019;3:026002. doi: 10.1103/PhysRevMaterials.3.026002. - DOI
Grants and funding
LinkOut - more resources
Full Text Sources
