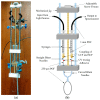
Novel Corrugated Long Period Grating Surface Balloon-Shaped Heterocore-Structured Plastic Optical Fibre Sensor for Microalgal Bioethanol Production
- PMID: 36772687
- PMCID: PMC9921262
- DOI: 10.3390/s23031644
Novel Corrugated Long Period Grating Surface Balloon-Shaped Heterocore-Structured Plastic Optical Fibre Sensor for Microalgal Bioethanol Production
Abstract
A novel long period grating (LPG) inscribed balloon-shaped heterocore-structured plastic optical fibre (POF) sensor is described and experimentally demonstrated for real-time measurement of the ultra-low concentrations of ethanol in microalgal bioethanol production applications. The heterocore structure is established by coupling a 250 μm core diameter POF between two 1000 μm diameter POFs, thus representing a large core-small core-large core configuration. Before coupling as a heterocore structure, the sensing region or small core fibre (SCF; i.e., 250 μm POF) is modified by polishing, LPG inscription, and macro bending into a balloon shape to enhance the sensitivity of the sensor. The sensor was characterized for ethanol-water solutions in the ethanol concentration ranges of 20 to 80 %v/v, 1 to 10 %v/v, 0.1 to 1 %v/v, and 0.00633 to 0.0633 %v/v demonstrating a maximum sensitivity of 3 × 10⁶ %/RIU, a resolution of 7.9 × 10⁻⁶ RIU, and a limit of detection (LOD) of 9.7 × 10⁻⁶ RIU. The experimental results are included for the intended application of bioethanol production using microalgae. The characterization was performed in the ultra-low-level ethanol concentration range, i.e., 0.00633 to 0.03165 %v/v, that is present in real culturing and production conditions, e.g., ethanol-producing blue-green microalgae mixtures. The sensor demonstrated a maximum sensitivity of 210,632.8 %T/%v/v (or 5 × 10⁶ %/RIU as referenced from the RI values of ethanol-water solutions), resolution of 2 × 10⁻⁴%v/v (or 9.4 × 10⁻⁶ RIU), and LOD of 4.9 × 10⁻⁴%v/v (or 2.3 × 10⁻⁵ RIU). Additionally, the response and recovery times of the sensor were investigated in the case of measurement in the air and the ethanol-microalgae mixtures. The experimentally verified, extremely high sensitivity and resolution and very low LOD corresponding to the initial rate of bioethanol production using microalgae of this sensor design, combined with ease of fabrication, low cost, and wide measurement range, makes it a promising candidate to be incorporated into the bioethanol production industry as a real-time sensing solution as well as in other ethanol sensing and/or RI sensing applications.
Keywords: bioethanol production using microalgae; ethanol sensor; heterocore structure; long period grating; macro bending; plastic optical fibre.
Conflict of interest statement
The authors declare no conflict of interest.
Figures


Similar articles
-
Refractive index sensor based on a multi-notched plastic optical fiber.Appl Opt. 2017 Mar 1;56(7):1833-1838. doi: 10.1364/AO.56.001833. Appl Opt. 2017. PMID: 28248378
-
Refractive Index Sensing with D-Shaped Plastic Optical Fibers for Chemical and Biochemical Applications.Sensors (Basel). 2016 Dec 13;16(12):2119. doi: 10.3390/s16122119. Sensors (Basel). 2016. PMID: 27983608 Free PMC article.
-
Refractive Index Sensor Based on Double Side-Polished U-Shaped Plastic Optical Fiber.Sensors (Basel). 2020 Sep 14;20(18):5253. doi: 10.3390/s20185253. Sensors (Basel). 2020. PMID: 32937972 Free PMC article.
-
Microalgae starch: A promising raw material for the bioethanol production.Int J Biol Macromol. 2020 Dec 15;165(Pt B):2739-2749. doi: 10.1016/j.ijbiomac.2020.10.159. Epub 2020 Oct 24. Int J Biol Macromol. 2020. PMID: 33470200 Review.
-
Optical Fibre-Based Sensors-An Assessment of Current Innovations.Biosensors (Basel). 2023 Aug 22;13(9):835. doi: 10.3390/bios13090835. Biosensors (Basel). 2023. PMID: 37754069 Free PMC article. Review.
References
-
- Godbole V., Pal M.K., Gautam P. A Critical Perspective on the Scope of Interdisciplinary Approaches Used in Fourth-Generation Biofuel Production. Algal Res. 2021;58:102436. doi: 10.1016/j.algal.2021.102436. - DOI
-
- Pembroke J.T., Quinn L., O’Riordan H., Sheahan C., Armshaw P. Cyanobacteria: Omics and Manipulation. Caister Academic Press; Poole, UK: 2017. Ethanol Production in Cyanobacteria: Impact of Omics of the Model Organism Synechocystis on Yield Enhancement; pp. 199–217.
Grants and funding
- Doctoral Scholarship/European Union Erasmus Mundus INTACT Program
- Postgraduate Research Residential Scholarship/Plassey Campus Centre, University of Limerick, Ireland
- PhD Funding/Department of Electronic and Computer Engineering, University of Limerick, Ireland
- SFI/12/RC/2302_P2/SFI_/Science Foundation Ireland/Ireland
- University of Limerick's programme for Covid-19 Related Research Costed Extensions/Higher Education Authority and the Government of Ireland Department of Further and Higher Education, Research, Innovation, and Science
LinkOut - more resources
Full Text Sources

