

An Affordable NIR Spectroscopic System for Fraud Detection in Olive Oil
- PMID: 36772764
- PMCID: PMC9920304
- DOI: 10.3390/s23031728
An Affordable NIR Spectroscopic System for Fraud Detection in Olive Oil
Abstract
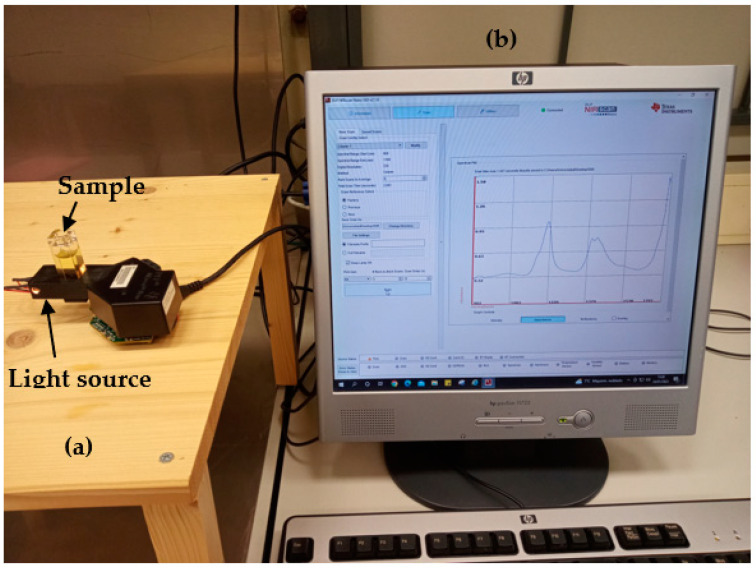
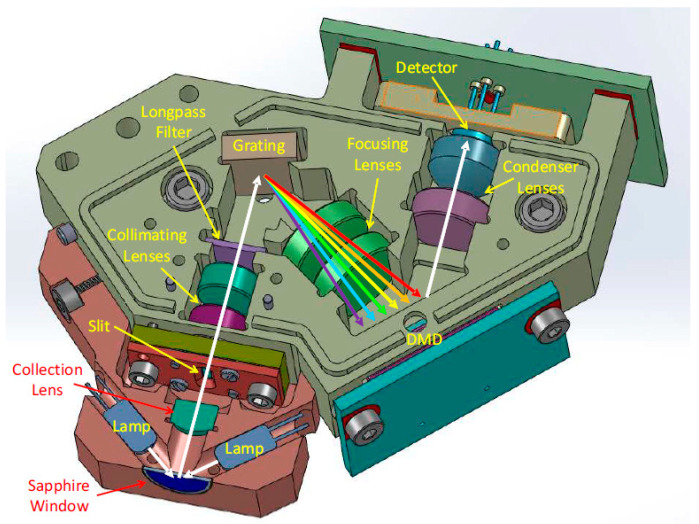
Adulterations of olive oil are performed by adding seed oils to this high-quality product, which are cheaper than olive oils. Food safety controls have been established by the European Union to avoid these episodes. Most of these methodologies require expensive equipment, time-consuming procedures, and expert personnel to execute. Near-infrared spectroscopy (NIRS) technology has many applications in the food processing industry. It analyzes food safety and quality parameters along the food chain. Using principal component analysis (PCA), the differences and similarities between olive oil and seed oils (sesame, sunflower, and flax oil) have been evaluated. To quantify the percentage of adulterated seed oil in olive oils, partial least squares (PLS) have been employed. A total of 96 samples of olive oil adulterated with seed oils were prepared. These samples were used to build a spectra library covering various mixtures containing seed oils and olive oil contents. Eighteen chemometric models were developed by combining the first and second derivatives with Standard Normal Variable (SNV) for scatter correction to classify and quantify seed oil adulteration and percentage. The results obtained for all seed oils show excellent coefficients of determination for calibration higher than 0.80. Because the instrumental aspects are not generally sufficiently addressed in the articles, we include a specific section on some key aspects of developing a high-performance and cost-effective NIR spectroscopy solution for fraud detection in olive oil. First, spectroscopy architectures are introduced, especially the Texas Instruments Digital Light Processing (DLP) technology for spectroscopy that has been used in this work. These results demonstrate that the portable prototype can be used as an effective tool to detect food fraud in liquid samples.
Keywords: Digital Light Processing (DLP); Digital Micromirror Device (DMD); Near-Infrared Spectroscopy (NIRS); Partial Least Squares (PLS); Principal Component Analysis (PCA); instrumentation; olive oil; spectroscopic.
Conflict of interest statement
The authors declare no conflict of interest.
Figures


References
-
- World Health Organization . Toxic Oil Syndrome: Current Knowledge and Future Perspectives. Introduction. Volume 42. World Health Organization. Regional Office for Europe; Geneva, Switzerland: 1992. pp. 1–4. - PubMed
-
- Andrikopoulos N.K., Giannakis I.G., Tzamtzis V. Analysis of olive oil and seed oil triglycerides by capillary gas chromatography as a tool for the detection of the Adulteration of Olive Oil. J. Chromatogr. Sci. 2001;39:137–145. - PubMed
-
- Meenu M., Cai Q., Xu B. A critical review on analytical techniques to detect adulteration of extra virgin olive oil. Trends Food Sci. Technol. 2019;91:391–408.
-
- Chen H., Lin Z., Tan C. Fast quantitative detection of sesame oil adulteration by near-infrared spectroscopy and chemometric models. Vib. Spectrosc. 2018;99:178–183. doi: 10.1016/j.vibspec.2018.10.003. - DOI
MeSH terms
Substances
Grants and funding
LinkOut - more resources
Full Text Sources
Miscellaneous
