. 2023 Feb 3;23(3):1745.
doi: 10.3390/s23031745.

Core versus Surface Sensors for Reinforced Concrete Structures: A Comparison of Fiber-Optic Strain Sensing to Conventional Instrumentation

Affiliations

Core versus Surface Sensors for Reinforced Concrete Structures: A Comparison of Fiber-Optic Strain Sensing to Conventional Instrumentation

Ryan Hoult et al. Sensors (Basel). .

Abstract

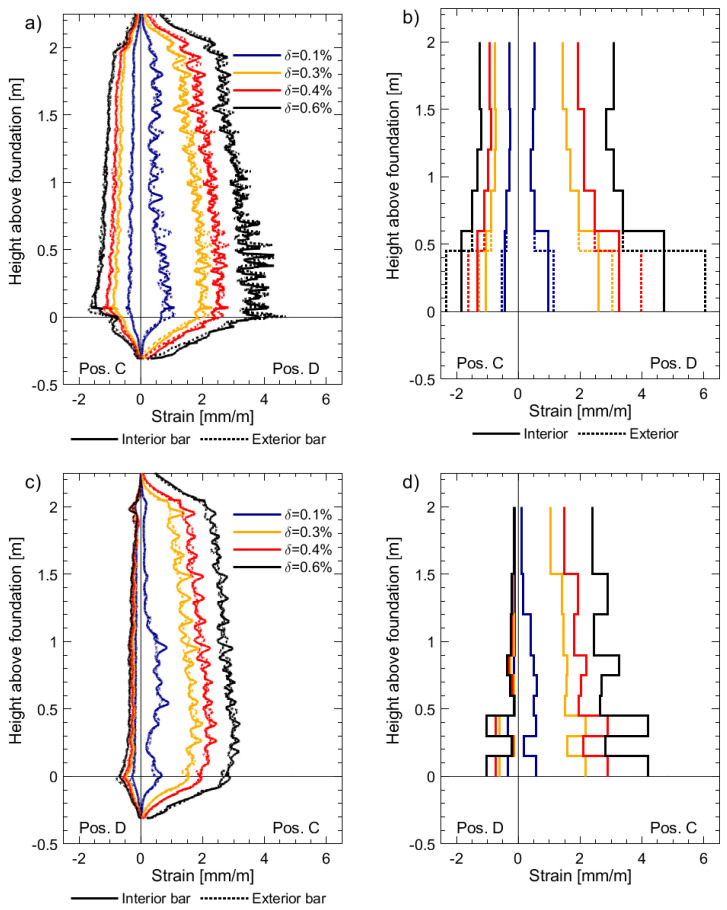
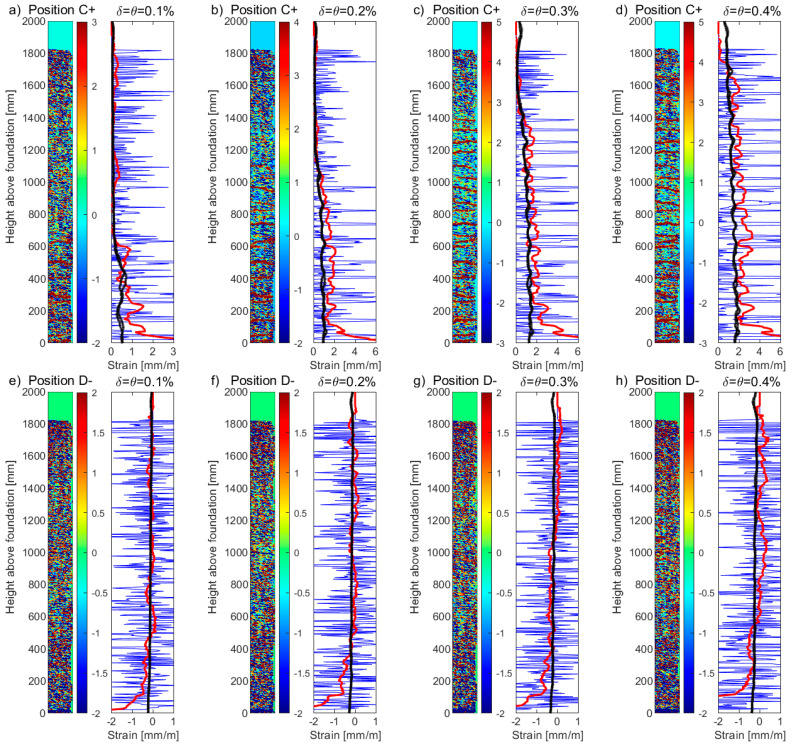
High-resolution distributed reinforcement strain measurements can provide invaluable information for developing and evaluating numerical and analytical models of reinforced concrete structures. A recent testing campaign conducted at UCLouvain in Belgium used fiber-optic sensors embedded along several longitudinal steel rebars of three reinforced concrete U-shaped walls. The resulting experimental dataset provides an opportunity to evaluate and compare, for different types of loading, the strain measurements obtained with the fiber-optic sensors in the confined core of the structural member against more conventional and state-of-the-practice sensors that monitor surface displacements and deformations. This work highlights the need to average strain measurements from digital image correlation techniques in order to obtain coherent results with the strains measured from fiber optics, and investigates proposals to achieve this relevant goal for research and engineering practices. The longitudinal strains measured by the fiber optics also provide additional detailed information on the behavior of these wall units compared to the more conventional instrumentation, such as strain penetration into the foundation and head of the wall units, which are studied in detail.

Keywords: DFOS; DIC; DOFS; RC; fiber optic; optical; strain penetration; walls; yield.


Conflict of interest statement

The authors declare no conflict of interest.

Figures

Figure 1
Figure 1
(a) Cross-section and reinforcement layout with indication of DFOS rebars and micrometer instruments (M1–M16, clockwise from boundary end of west flange); and (b) Elevation view of wall units with indication of the LVDT chain on the west flange boundary end.
Figure 2
Figure 2
(a) Wall cross-section with the different loading positions; and (b) The different measurement instrumentation devices (not to scale; dimensions in mm).
Figure 3
Figure 3
Location of the longitudinal rebars instrumented with fiber-optic sensors (purple, full opacity rebars): (a) Elevation view of the wall from the west with fiber-optic channels (“ch”) 1, 2, 3, and 4; and (b) Elevation view of the wall from the south. The LVDT chain to the south, along the boundary end of the west flange, and to the north, along the corner of the west flange-web intersection, is also depicted.
Figure 4
Figure 4
(a) Graphical representation of the bonding technique to the rebars and welded segment used in the foundation; (b) Groove made along the longitudinal rebar, showing the rounded and welded segment used in the head to join the two parallel rebar layers; and (c) the connector and termination of the fiber-optic cable was protected in the concrete footing using a plastic orange cone.
Figure 5
Figure 5
(a) 3-dimensional representation of the RC U-shaped wall units with foundation blocks and DIC strain results on the surface of the web; and (b) Corner-region “column” of the west flange-web intersection (100 × 100 mm2 cross-section) with DIC surface, embedded DFOS sensors (Channel 1), and LVDT chain, used in the current research.
Figure 6
Figure 6
Photos of the inside edge of the west flange with micrometers (M1, M2, and M3) and base LVDTs attached close to the exterior and interior faces of the flange boundary end (a) Before testing of UW1; and (b) At LS34 of UW3 (position C+) showing flexural-shear crack running through attachment point of M1.
Figure 7
Figure 7
Longitudinal strain profiles for unit UW1 subjected to pure flexure at different imposed drifts: (a) Channel 4 of the DFOS; (b) chain of LVDTs located on the west flange boundary end; (c) Channel 1 of the DFOS; and (d) chain of LVDTs located on the west flange-web intersection.
Figure 8
Figure 8
Longitudinal strain profiles for unit UW2 subjected to pure torsion at different imposed twists: (a) Channel 4 of the DFOS; (b) Chain of LVDTs located on the west flange boundary end; (c) Channel 1 of the DFOS; and (d) Chain of LVDTs located on the west flange-web intersection.
Figure 9
Figure 9
Longitudinal strain profiles for unit UW3 subjected to a combination of flexure and torsion: (a) Channel 4 of the DFOS; (b) Chain of LVDTs located on the west flange boundary end; (c) Channel 1 of the DFOS; and (d) Chain of LVDTs located on the west flange-web intersection.
Figure 10
Figure 10
DIC strains profiles for the web-West flange intersection of wall unit UW1 at: (a) Position D (compression); and (b) Position C (tension) at δ = 0.6%. A moving average was used to smooth the DIC profiles using different span base lengths (Bl = 50 mm, 100 mm, and 200 mm). The strain profiles are compared to the profiles measured from the average of the DFOS strain profiles (black solid lines) and LVDT strains (black dashed lines).
Figure 11
Figure 11
DIC and DFOS longitudinal strain profiles for the west web-flange intersection of wall unit UW1 subjected to flexure, in tension (Position C): (a) δ = −0.2%; (b) δ = −0.4%; (c) δ = −0.6%; (d) δ = −0.8%, and in compression (Position D); (e) δ = 0.2%; (f) δ = 0.4%; (g) δ = 0.6%; and (h) δ = 0.8%. The thin blue lines are the uncorrected strains determined from the DIC data, whereas the thick red lines are the corrected strains (i.e., moving average over 200 mm) determined from the DIC data. The solid black lines are the strain measurements from the DFOS (i.e., 2 × Φ12 rebars, Channel 1). A heatmap is provided next to each plot, representing the uncorrected, raw DIC strain (in units of mm/m).
Figure 12
Figure 12
DIC and DFOS longitudinal strain profiles for the west web-flange intersection of wall unit UW2 subjected to torsion, in tension (Position O−): (a) θ = −15 mrad; (b) θ = −20 mrad; (c) θ = −25 mrad; (d) θ = −30 mrad, and in compression (Position O+); (e) θ = 15 mrad; (f) θ = 20 mrad; (g) θ = 25 mrad; and (h) θ = 30 mrad. The thin blue lines are the uncorrected strains determined from the DIC data, whereas the thick red lines are the corrected strains (i.e., moving average over 200 mm) determined from the DIC data. The solid black lines are the strain measurements from the DFOS (i.e., 2 × Φ12 rebars, Channel 1). A heatmap is provided next to each plot, representing the uncorrected, raw DIC strain (in units of mm/m).
Figure 13
Figure 13
DIC and DFOS longitudinal strain profiles for the west web-flange intersection of wall unit UW3 subjected to flexure and torsion, in tension (Position C+): (a) δ = −0.1%, θ = 1 mrad; (b) δ = −0.2%, θ = 2 mrad; (c) δ = −0.3%, θ = 3 mrad; (d) δ = −0.4%, θ = 4 mrad and in compression (Position D); (e) δ = 0.1%, θ = −1 mrad; (f) δ = 0.2%, θ = −2 mrad; (g) δ = 0.3%, θ = −3 mrad; and (h) δ = 0.4%, θ = −4 mrad. The blue thin lines are the uncorrected strains determined from the DIC data, whereas the red thick lines are the corrected strains (i.e., moving average over 200 mm) determined from the DIC data. The solid black lines are the strain measurements from the DFOS (i.e., 2 × Φ12 rebars, Channel 1). A heatmap is provided next to each plot, representing the uncorrected, raw DIC strain (in units of mm/m).
Figure 14
Figure 14
Anchorage slip (Δv) calculated from the distributed optical fiber sensor (DFOS) strain profiles compared to the micrometers for unit UW1 subjected to in-plane flexure: (a) DFOS Channel 2, Micrometer 5; (b) DFOS Channel 3, Micrometer 2; and (c) DFOS Channel 4, Micrometer 1.
Figure 15
Figure 15
Anchorage slip (Δv) calculated from the distributed optical fiber sensor (DFOS) strain profiles compared to the micrometers for unit UW2 subjected to torsion: (a) DFOS Channel 2, Micrometer 5; (b) DFOS Channel 3, Micrometer 2; and (c) DFOS Channel 4, Micrometer 1.
Figure 16
Figure 16
Anchorage slip (Δv) calculated from the distributed optical fiber sensor (DFOS) strain profiles compared to the micrometers for unit UW3 subjected to torsion and flexure: (a) DFOS Channel 2, Micrometer 5; (b) DFOS Channel 3, Micrometer 2; and (c) DFOS Channel 4, Micrometer 1.

Similar articles

Cited by

References

    1. Scott R., Gill P.A. Short-term distributions of strain and bond stress along tension reinforcement. Struct. Eng. 1987;65:39–43.
    1. Kaklauskas G. Crack Model for RC Members Based on Compatibility of Stress-Transfer and Mean-Strain Approaches. J. Struct. Eng. 2017;143:04017105. doi: 10.1061/(ASCE)ST.1943-541X.0001842. - DOI
    1. Berrocal C.G., Fernandez I., Rempling R. Crack monitoring in reinforced concrete beams by distributed optical fiber sensors. Struct. Infrastruct. Eng. 2021;17:124–139. doi: 10.1080/15732479.2020.1731558. - DOI - PMC - PubMed
    1. Shima H., Chou L.-L., Okamura H. Micro and macro models for bond in reinforced concrete. J. Fac. Eng. 1987;39:133–194.
    1. Woods J.E., Lau D.T., Bao X., Li W. Measuring strain fields in FRP strengthened RC shear walls using a distributed fiber optic sensor. Eng. Struct. 2017;152:359–369. doi: 10.1016/j.engstruct.2017.09.034. - DOI

LinkOut - more resources