. 2023 Feb;13(2):e1189.
doi: 10.1002/ctm2.1189.

Dissecting the role of cancer-associated fibroblast-derived biglycan as a potential therapeutic target in immunotherapy resistance: A tumor bulk and single-cell transcriptomic study

Affiliations

Dissecting the role of cancer-associated fibroblast-derived biglycan as a potential therapeutic target in immunotherapy resistance: A tumor bulk and single-cell transcriptomic study

Shaoquan Zheng et al. Clin Transl Med. 2023 Feb.

Abstract

Introduction: Cancer-associated fibroblasts (CAFs) are correlated with the immunotherapy response. However, the culprits that link CAFs to immunotherapy resistance are still rarely investigated in real-world studies.

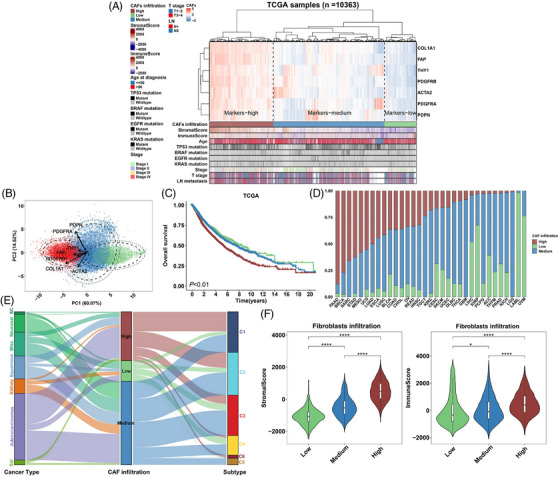
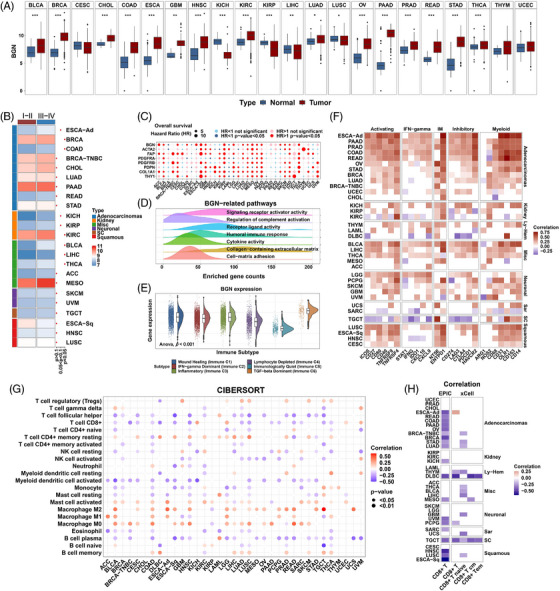
Objectives: This study aims to systematically assess the landscape of fibroblasts in cancer patients by combining single-cell and bulk profiling data from pan-cancer cohorts. We further sought to decipher the expression, survival predictive value and association with immunotherapy response of biglycan (BGN), a proteoglycan in the extracellular matrix, in multiple cohorts.

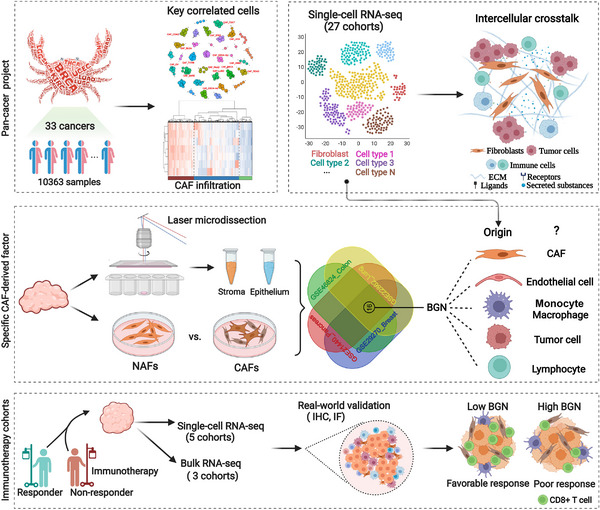
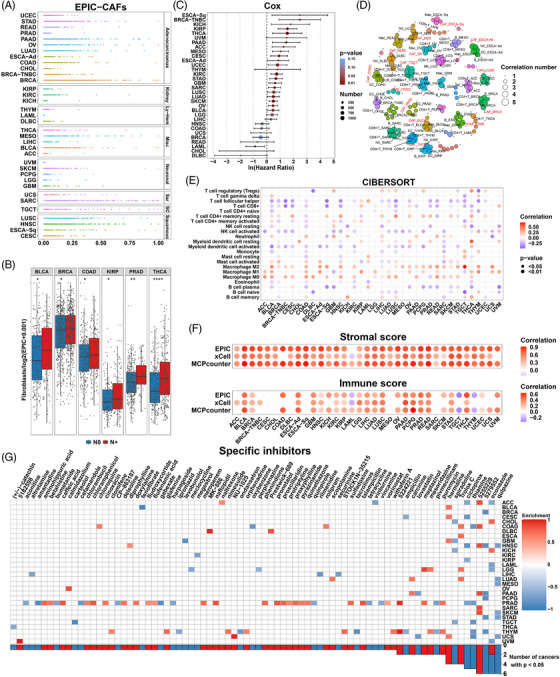
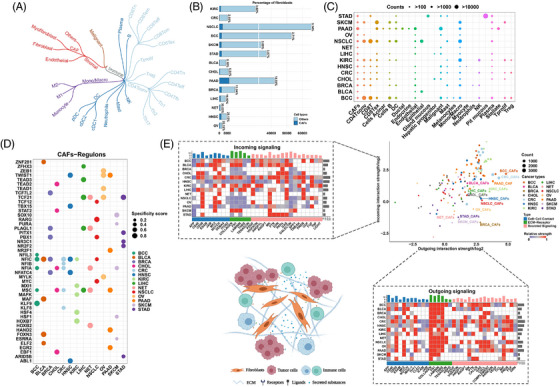
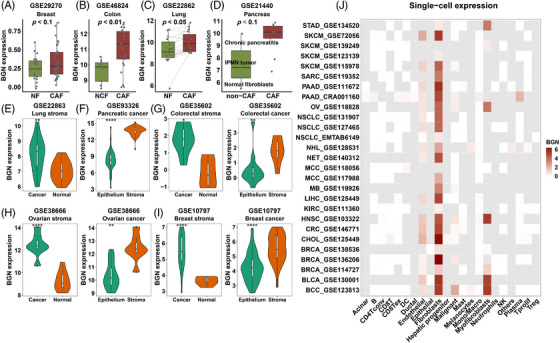
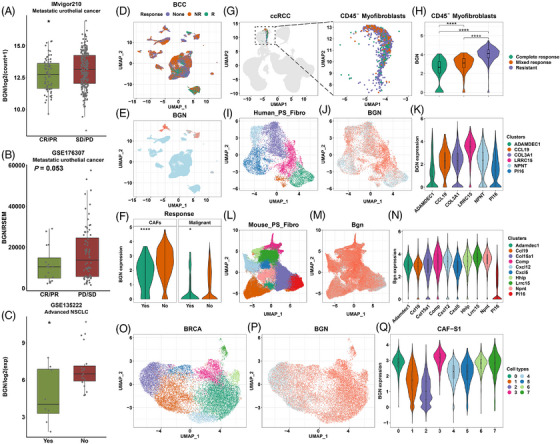
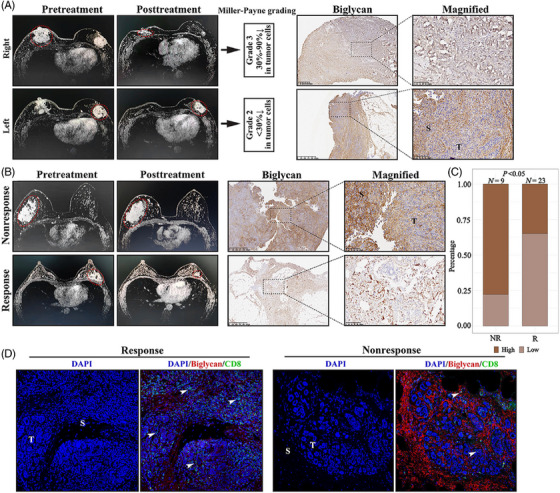
Methods: Pan-cancer tumor bulks and 27 single-cell RNA sequencing cohorts were enrolled to investigate the correlations and crosstalk between CAFs and tumor or immune cells. Specific secreting factors of CAFs were then identified by expression profiling at tissue microdissection, isolated primary fibroblasts and single-cell level. The role of BGN was further dissected in additional three bulk and five single-cell profiling datasets from immunotherapy cohorts and validated in real-world patients who have received PD-1 blockade using immunohistochemistry and immunofluorescence.

Results: CAFs were closely correlated with immune components. Frequent crosstalk between CAFs and other cells was revealed by the CellChat analysis. Single-cell regulatory network inference and clustering identified common and distinct regulators for CAFs across cancers. The BGN was determined to be a specific secreting factor of CAFs. The BGN served as an unfavourable indicator for overall survival and immunotherapy response. In the real-world immunotherapy cohort, patients with high BGN levels presented a higher proportion of poor response compared with those with low BGN (46.7% vs. 11.8%) and a lower level of infiltrating CD8+ T cells was also observed.

Conclusions: We highlighted the importance of CAFs in the tumor microenvironment and revealed that the BGN, which is mainly derived from CAFs, may be applicable in clinical practice and serve as a therapeutic target in immunotherapy resistance.

Keywords: tumor microenvironment; cancer-associated fibroblasts; immunotherapy; tumor biomarker.


Conflict of interest statement

No conflict of interest is declared.

Figures

FIGURE 1
FIGURE 1
Schematic representation of the workflow in this study. 33 types of cancers from the TCGA pan‐cancer cohort were selected to explore the landscape of cancer‐associated fibroblasts. Tissue laser microdissection and single‐cell RNA sequencing were applied to examine biglycan expression and its value for immunotherapy.
FIGURE 2
FIGURE 2
Clinical relevance and significant roles of CAFs in the tumor microenvironment. (A) Relative abundance of EPIC‐estimated fibroblasts in 33 cancers from the TCGA pan‐cancer cohort. (B) Boxplots comparing the abundance of fibroblasts in cancer samples with or without lymph node metastasis. N0 (lymph node negative) and N+ (lymph node positive) are represented as blue and red, respectively. p values from Student's t‐test. (C) Hazard ratio for overall survival of higher fibroblast abundance. p values from Cox regression model. (D) Crucial components in TME of cancers. Correlation number: The number of other cells correlated with specific cells in the TME (criteria: |Correlation R| > 0.3 and p < 0.05). p values from Spearman correlation analysis. (E) Correlation between fibroblast score (EPIC) and CIBERSORT LM22 immune cell score. Only significant values are shown (p < 0.05). Positive and negative correlations are represented as red and blue. p values from Spearman correlation analysis. (F) Correlation between fibroblast score (EPIC) and ESTIMATE immune/stromal scores. Only significant values are shown (p < 0.05). Positive and negative correlations are represented as red and blue. p values from Spearman correlation analysis. (G) Heatmap showing enrichment scores of specific compounds from the cMAP database to target fibroblasts for the TCGA pan‐cancer cohorts. The inhibitors are sorted from left to right in the order of ascending number of significantly enriched cancer types. Positive and negative enrichment scores are represented as red and blue. p values from cMAP analysis. p values are reported as follows: ns, nonsignificant; *, p < 0.05; **, p < 0.01; ***, p < 0.001; ****, p < 0.0001.
FIGURE 3
FIGURE 3
Relative CAFs infiltration levels in pan‐cancer cohorts. (A) Heatmap showing the clustering of classic CAFs markers and different levels of relative CAFs infiltration in the TCGA pan‐cancer cohort (N = 10 363). Bars under the heatmap show distributions of ESTIMATE, mutation and clinical features. For clustering of markers and samples, euclidean and ward. D2 methods were applied. (B) PCA plot showing PCA components (x and y‐axes) based on CAFs markers. Arrows, the profiling tendency of markers; eclipse, 80%; internal circle, 95% confidence interval; external circle, 98% confidence interval. (C) Kaplan–Meier plots showing the overall survival analysis of different CAF‐infiltration groups in TCGA pan‐cancer cohort. Low, medium and high CAFs infiltration were represented as green, blue and red. p value from log‐rank test. (D) Barplot showing the percentage of different CAFs infiltration levels (y‐axis) in 33 cancers of the TCGA pan‐cancer cohort. (E) Sankey diagram depicting the relationship of cancer types, CAFs infiltration levels and immune subtypes. High, medium and low infiltration levels are represented as red, blue and green, respectively. (F) Violin plots comparing the ESTIMATE stromal (left) and immune (right) scores in different infiltration groups. p values from Kruskal–Wallis test. p Values are reported as ns, nonsignificant; *, p < 0.05; **, p < 0.01; ***, p < 0.001; ****, p < 0.0001.
FIGURE 4
FIGURE 4
Intercellular crosstalk and transcriptional analysis of CAFs in single‐cell sequencing cohorts. (A) Brief classification of malignant, immune and stromal components in the tumor microenvironment. (B) Barplot showing the counts and percentage of fibroblasts in the enrolled cohorts. CAFs and other cells are represented as dark blue and light blue. (C) Bubble plot showing the counts of individual cells in cohorts. The cell counts are represented by the bubble size. (D) Bubble plot showing the top five transcriptional modules analyzed by SCENIC. Specificity scores are represented by the bubble size. (E) The relative strength of incoming (top left) and outgoing (lower right) signalling for cancer‐associated fibroblasts analyzed by CellChat (strength is scaled within individual cancers, and increasing value is represented from purple to red); Scatter plot showing the signalling for all cells in cohorts (cancers are represented as different c, cell numbers are represented as the dot size). Illustration of different kinds of intercellular communications for fibroblasts (lower left).
FIGURE 5
FIGURE 5
Stromal biglycan is mainly expressed in cancer‐associated fibroblasts. (A) Boxplots comparing BGN expression in CAFs and non‐CAFs of breast (A), colon (B), lung (C) and pancreatic (D) tissues. (E–I) Violin plots comparing the BGN expression of tissue microdissection: the stromal part of normal and cancer tissues of lung, colorectal, ovarian and breast samples; the cancer epithelium and stromal part of pancreatic, colorectal, ovarian, breast cancer. (J) Heatmap showing BGN expression in cells of scRNA‐seq datasets. The log2(TPM/10+1) value is shown, and cells not available are represented as grey tile. p value from paired/non‐paired Student's t‐test (normally distributed) and Wilcoxon rank‐sum test (non‐normally distributed). CAFs and non‐CAFs are represented as red and green. P values are reported as follows: ns, nonsignificant; *, p < 0.05; **, p < 0.01; ***, p < 0.001; ****, p < 0.0001.
FIGURE 6
FIGURE 6
Clinical and tumor microenvironmental relevance of biglycan. (A) Boxplots comparing BGN expression between normal and cancer tissues from the merged TCGA‐GTEx cohort. Normal and tumor are represented as blue and red. p value from Student's t‐test. (B) Heatmap showing BGN expression in stage I–II and stage III–IV patients. p value from Student's t‐test. (C) Bubble plot showing the hazard ratio for BGN and classic CAFs markers analyzed by univariate Cox regression model. (D) Density plots showing Gene Ontology enrichment. The frequency (y‐axis) of enriched gene counts in cancer is shown. (E) Violin and dot plots showing BGN expression in immune subtypes of the TCGA cohort. p value from one‐way ANOVA test. (F) Heatmap showing the correlation between BGN and immune‐related genes. Correlation values without statistical significance are represented as blank. (G) Bubble plot showing the correlation of BGN expression and CIBERSORT LM22 immune cells. (H) Heatmap showing the correlation of BGN expression and CD8+ T cell infiltration calculated by EPIC and xCell algorithms. Positive and negative correlations are represented as red and blue. p value from Spearman correlation analysis. p values are reported as ns, nonsignificant; *, p < 0.05; **, p < 0.01; ***, p < 0.001; ****, p < 0.0001.
FIGURE 7
FIGURE 7
BGN predicts poor response of patients to immunotherapy. Boxplots comparing BGN expression in patients responding or not responding to immunotherapies in metastatic urothelial cancer (A, B) and advanced non‐small cell lung cancer (C). p values from Student's t‐test. BCC scRNA‐seq: Scatter plot showing the distribution of cells from NR (nonresponse), R (response) and None (no record) (D); BGN expression in cells (E); violin plots comparing BGN expression in CAFs and malignant cells of patients with or without response (F). Responses and nonresponses are represented as green and brown, respectively. p value from Student's t‐test. ccRCC scRNA‐seq: Scatter plots showing CD45‐ myofibroblasts (G). Violin plot shows BGN expression in fibroblasts of the complete response, mixed response and resistance groups (H). p value from one‐way ANOVA test and corrected. Complete response, mix response and resistance are represented as green, brown and purple, respectively. Cross‐tissue fibroblast subsets: I–K, Different subsets of human fibroblasts and BGN distribution; L and M, Different subsets of mouse fibroblasts and BGN distribution. Breast cancer CAF‐S1 subsets: Scatter plot showing fibroblast CAF‐S1 subsets (O) and BGN distribution (P); Violin plot showing BGN expression in subsets 0–7 (Q). p values are reported as follows: ns, nonsignificant; *, p < 0.05; **, p < 0.01; ***, p < 0.001; ****, p < 0.0001.
FIGURE 8
FIGURE 8
Validation of the correlation between biglycan and immunotherapy response in a clinical cohort. (A) The magnetic resonance imaging (left panel), Miller–Payne grade (middle panel) and immunohistochemical biglycan expression (right panel) in a patient diagnosed with bilateral breast cancer. (B) Representative images of magnetic resonance imaging (left panel) and immunohistochemical biglycan expression (right panel) in response and nonresponse groups. (C) Bar plot showing the proportion of high and low biglycan expression in NR (nonresponse) and R (response) groups. p value from Fisher exact test. (D) Representative image of immunofluorescence showing the biglycan expression and CD8+ T cell infiltration in response and nonresponse groups.

References

    1. Sung H, Ferlay J, Siegel RL, et al. Global Cancer Statistics 2020: gLOBOCAN estimates of incidence and mortality worldwide for 36 cancers in 185 countries. CA Cancer J Clin. 2021;71:209‐249. doi:10.3322/caac.21660 - DOI - PubMed
    1. Mueller MM, Fusenig NE. Friends or foes ‐ bipolar effects of the tumour stroma in cancer. Nature reviews Cancer. 2004;4:839‐849. - PubMed
    1. Dvorak HF. Tumors: wounds that do not heal. Similarities between tumor stroma generation and wound healing. N Engl J Med. 1986. - PubMed
    1. Sahai E, Astsaturov I, Cukierman E, et al. A framework for advancing our understanding of cancer‐associated fibroblasts. Nat Rev Cancer. 2020;20:174‐186. doi:10.1038/s41568-019-0238-1 - DOI - PMC - PubMed
    1. Chen X, Song E. Turning foes to friends: targeting cancer‐associated fibroblasts. Nat Rev Drug Discov. 2019;18:99‐115. doi:10.1038/s41573-018-0004-1 - DOI - PubMed

Publication types