. 2023 Feb 11;14(1):789.
doi: 10.1038/s41467-023-36439-7.

Genomic and microenvironmental heterogeneity shaping epithelial-to-mesenchymal trajectories in cancer

Affiliations

Genomic and microenvironmental heterogeneity shaping epithelial-to-mesenchymal trajectories in cancer

Guidantonio Malagoli Tagliazucchi et al. Nat Commun. .

Abstract

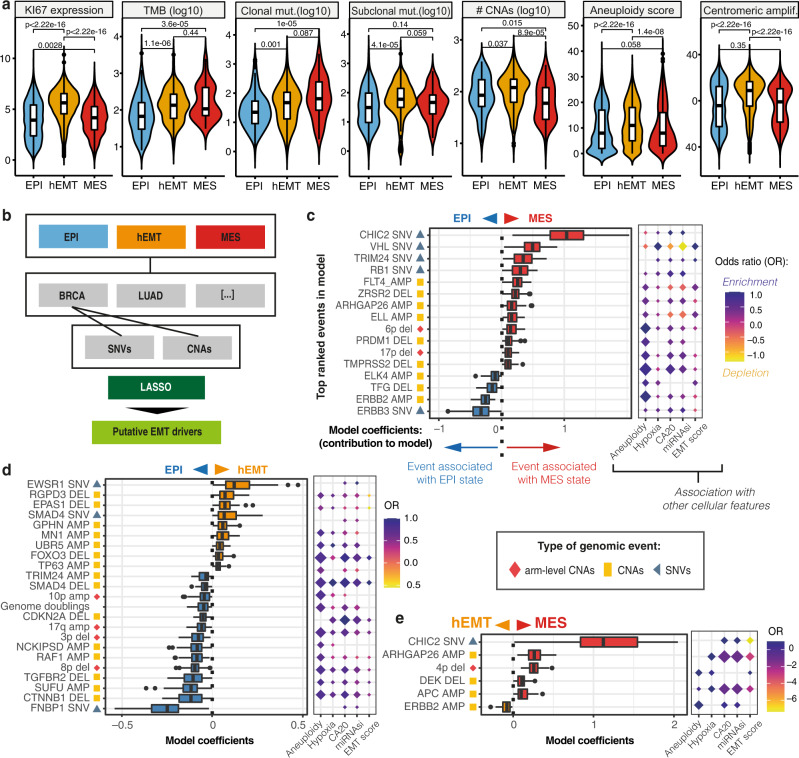
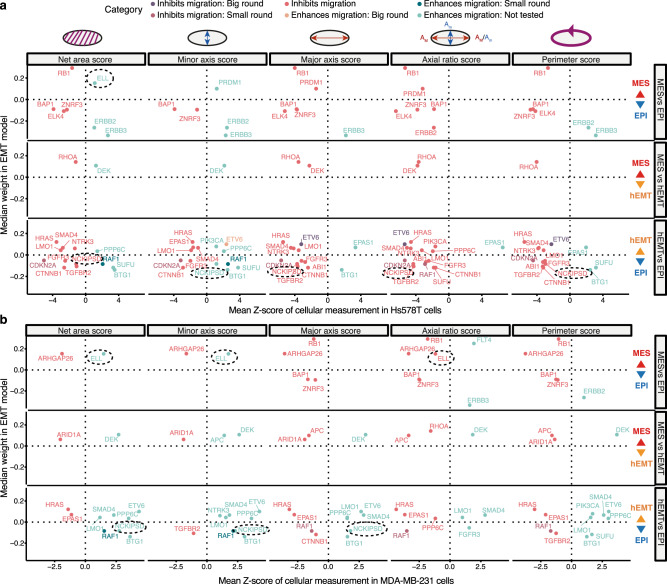
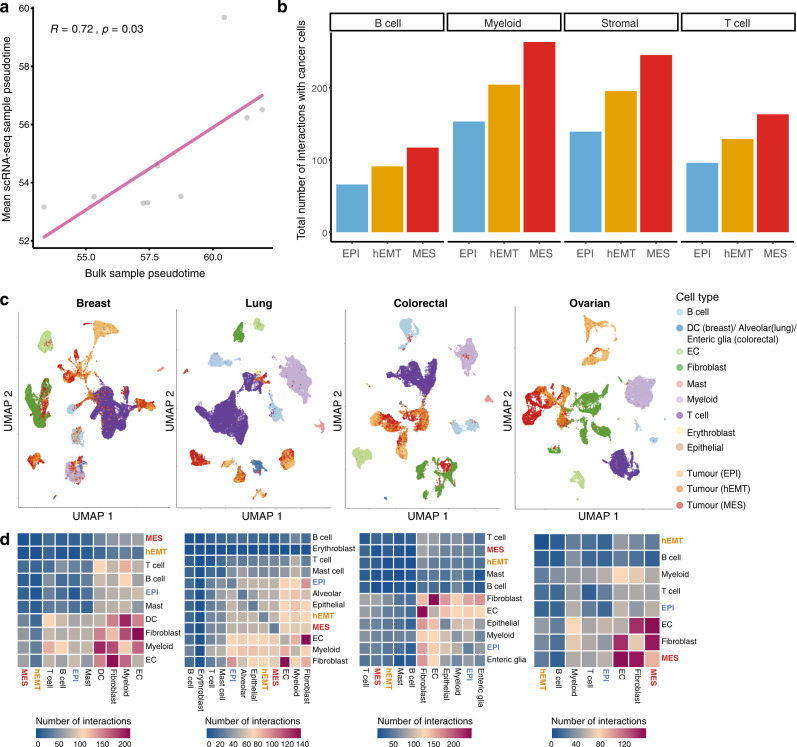
The epithelial to mesenchymal transition (EMT) is a key cellular process underlying cancer progression, with multiple intermediate states whose molecular hallmarks remain poorly characterised. To fill this gap, we present a method to robustly evaluate EMT transformation in individual tumours based on transcriptomic signals. We apply this approach to explore EMT trajectories in 7180 tumours of epithelial origin and identify three macro-states with prognostic and therapeutic value, attributable to epithelial, hybrid E/M and mesenchymal phenotypes. We show that the hybrid state is relatively stable and linked with increased aneuploidy. We further employ spatial transcriptomics and single cell datasets to explore the spatial heterogeneity of EMT transformation and distinct interaction patterns with cytotoxic, NK cells and fibroblasts in the tumour microenvironment. Additionally, we provide a catalogue of genomic events underlying distinct evolutionary constraints on EMT transformation. This study sheds light on the aetiology of distinct stages along the EMT trajectory, and highlights broader genomic and environmental hallmarks shaping the mesenchymal transformation of primary tumours.


Conflict of interest statement

The authors declare no competing interests.

Figures

Fig. 1
Fig. 1. Reconstruction and validation of EMT trajectories from transcriptomics data.
a Workflow for reconstructing the EMT trajectories from bulk/single-cell RNA-seq data. 1: Bulk and single-cell datasets are processed together to remove batch effects. 2: Dimensionality reduction using PCA is performed. 3: A k-nearest neighbours (kNN) algorithm is used to map new samples onto a reference EMT trajectory derived from scRNA-seq data. 4: Tumours are sorted by mesenchymal potential along an EMT pseudotime axis. T = EMT value at the specific time point, n = number of neighbours for sample i. b Distribution of EMT pseudotime values inferred using different single-cell RNA-seq templates. The consensus template combines all 10 datasets. c Application of the EMT trajectory reconstruction method to a time course experiment of A549 lung adenocarcinoma lines treated with TGF-beta. The pseudotime estimate increases with time as expected for gradually transforming cells. Replicates are depicted in different colours. d Scatter plot of EMT scores along the pseudotime across TCGA cancers. Each dot corresponds to a sample, coloured by its designated state. e Diagram of the transition probabilities for switching from one EMT state to another, as estimated by the HMM model. f EMT scores differ significantly across biologically independent samples from TCGA in the epithelial (n = 3388), hEMT (n = 2764), mesenchymal (n = 1028) category, and the MET500 cohort (n = 496) (Kruskal–Wallis test p < 2.2e-16). The box centerlines depict the medians, and the edges depict the first/third quartiles. g EMT scores compared between cell lines from CCLE classified as non-metastatic (n = 116), weakly metastatic (n = 249), metastatic (n = 111) according to MetMap500. The box centerlines depict the medians, and the edges depict the first/third quartiles. Two-sided Wilcoxon rank-sum test p values are displayed. h Association plot between the HMM-derived cell line states (rows) and their experimentally measured metastatic potential (columns) (conditional independence test p = 2.2e-16). Source data are provided as a Source Data file.
Fig. 2
Fig. 2. Pan-cancer distribution of EMT macro-states.
a Distribution of the EMT states across different cancer tissues. The fraction of EPI, MES and hEMT samples are indicated in different colours. Each quarter of the pie corresponds to 25% of the data. The number of samples analysed is indicated for each tissue. Tissue abbreviations are explained in Source Data 2a. b EMT score distribution compared between early, late-stage primaries and metastatic samples. The colours indicate the assigned EMT state by our method. Source data are provided as a Source Data file.
Fig. 3
Fig. 3. Genomic hallmarks of EMT.
a Expression of the proliferation marker Ki67, tumour mutational burden (TMB), number of clonal/subclonal mutations (mut.), copy number aberration (CNA) burden, aneuploidy and centromeric amplification (amplif.) levels compared across biologically independent samples from TCGA in the epithelial (n = 3080), hEMT (n = 2856), mesenchymal (n = 1006) states. The centerline of boxes depicts the median values; the bottom and top box edges correspond to the first and third quartiles. Two-sided Wilcoxon signed-rank test p values are displayed. b The analytical workflow used to detect genomic events linked with EMT. For each state and cancer type, we used dNdScv, single nucleotide variants (SNVs) and copy number alterations (CNAs) enrichment to prioritise mutated genes and copy number events, respectively. These genomic events were then employed as input for lasso modelling to classify EMT states. c Top-ranked genomic markers distinguishing the mesenchymal (n = 822) from the epithelial (n = 2710) state. The box plots depict the estimated contributions of each marker to the model across 1000 model iterations. The centerline of boxes depicts the median values; the bottom and top box edges correspond to the first and third quartiles. The balloon chart on the right illustrates the association between each marker and aneuploidy, hypoxia, centromeric amplification (CA20), stemness index (mRNAsi) and EMT score. The size of the diamonds is proportional to the significance of association, the colour gradient reports the odds ratios (OR). d List of the top-ranked genomic markers distinguishing the hEMT (n = 2211) from the EPI (n = 2710) state and their associated hallmarks. The annotations are as described in c. e List of the top-ranked genomic markers distinguishing the hEMT (n = 2211) from the MES (n = 822) state and their associated hallmarks. The annotations are as described in c. Source data are provided as a Source Data file.
Fig. 4
Fig. 4. Validation of genomic associations with EMT using siRNA screens.
a Gene knockdown effects on cell migration abilities in Hs578T a and MDA-MB-231 b cell lines (data from Koedoot et al.). The x axis depicts a change in the following measurements in the cells upon the knockdown: net surface area, length of minor (Am) and major (AM) axes, axis ratio (large/small: elongated cells, close to 1: round cells), perimeter score (larger—more migration). The y axis depicts the median weight of the gene in the model distinguishing two different EMT states. Larger absolute weights indicate more confident associations with EMT. The genes are coloured according to the suggested phenotype by the respective cellular measurement. A few of the genes highlighted have undergone further phenotypic tests and this is indicated by the confirmed phenotype (big/small round). The rest of the genes were not further tested in the study (Not tested). Only candidates with a Z score value of cellular measurement >1 or <−1 are shown. The genes ELL and NCKIPSD are highlighted with dotted ovals as they are less well characterised in the context of EMT. Source data are provided as a Source Data file.
Fig. 5
Fig. 5. Tumour extrinsic hallmarks of EMT.
a Heat map showcasing the results of a multinomial logistic regression model trained to predict EMT states based on cell infiltration in the microenvironment. Each row corresponds to a cell type and the corresponding per-sample infiltration is highlighted via single-sample Gene Set Enrichment Analysis (ssGSEA) scores reported on the x axis. The values reported in the heat map are the probabilities that a sample should fall into the epithelial, hEMT or mesenchymal categories in relation to the ssGSEA score of a certain cell type. b Cell abundance compared across biologically independent samples in the epithelial (n = 3388), hEMT (n = 2764) and mesenchymal (n = 1028) states for selected cell types. The centerline of boxes depicts the median values; the bottom and top box edges correspond to the first and third quartiles. Two-sided Wilcoxon rank-sum test p values are displayed. c Levels of exhaustion quantified across biologically independent samples in the epithelial (n = 3388), hEMT (n = 2764) and mesenchymal (n = 1028) states. The centerline of boxes depicts the median values; the bottom and top box edges correspond to the first and third quartiles. Two-sided Wilcoxon rank-sum test p-values are displayed. d Median hypoxia values in the three different EMT states across tissues are indicated by the colour gradient. e Gene-expression levels of the stemness marker CD44 compared across the biologically independent samples in the epithelial (n = 3388), hEMT (n = 2764) and mesenchymal (n = 1028) states. The centerline of boxes depicts the median values; the bottom and top box edges correspond to the first and third quartiles. Two-sided Wilcoxon rank-sum test p values are displayed. Source data are provided as a Source Data file.
Fig. 6
Fig. 6. Spatial patterns of EMT.
a, b EMT scores and the fraction of fibroblasts are visualised across within individual spots profiled across the tissue in a selected breast cancer slide, derived from spatial transcriptomics data from Patient 1 of the Visium dataset. The colour gradient reflects the expression of markers of the specific cell state (for EMT) or the fraction of cell types (for fibroblasts). c Enrichment and depletion of cell types in each EMT-based cluster from Patient 1. The plots represent the difference between the average cell type proportion value per region, compared to a permuted spot value (calculated 10,000 times). The plot marker size corresponds to the absolute enrichment score, and the colour represents the enrichment sign. PMN polymorphonuclear neutrophils, PC plasma cells, NK natural killer, macroph macrophages. df The same annotations as above for a breast cancer sample from Patient 2 of the Visium dataset. gi The same annotations as above for a breast cancer sample from Patient 3 of the Visium dataset. j Enrichment and depletion of cell types in EMT-based clusters derived from multi-region spatial transcriptomics slides from the ST2K cohort. Annotation as in c. CAF cancer-associated fibroblasts, myCAF myofibroblastic CAF, DC dendritic cells, PVC perivascular cells, NKT natural killer T cells. k Fraction of interactions established between tumour cells in the three EMT macro-states and fibroblasts or T cells in the Visium dataset. l Fraction of interactions established among cancer cells in different EMT macro-states in the Visium dataset. Source data are provided as a Source Data file.
Fig. 7
Fig. 7. EMT diversity in single-cell data.
a Comparison between EMT pseudotime estimates in matched bulk and single-cell samples from the same individuals (Pearson correlation coefficient R and p-value are shown). b Number of interactions established between tumour cells found in an EPI, hEMT, or MES state and other cells in the tumour microenvironment in the Chung et al. dataset. c Uniform Manifold Approximation and Projection (UMAP) reconstruction of single-cell expression profiles depicting the tumour and microenvironment landscape of breast, lung, colorectal and ovarian tumours from Qian et al.. Tumour cells are coloured according to their assigned EMT state (EPI/hEMT/MES). All other cells in the microenvironment are also depicted in different colours. DC dendritic cells, EC endothelial cells. d Heat maps depicting the total number of interactions established among all cell types in the same breast, lung, colorectal and ovarian datasets. The tumour cells are denoted by their EPI, hEMT and MES states. Source data are provided as a Source Data file.
Fig. 8
Fig. 8. Clinical relevance of the EMT states.
a Overall survival compared between MES, hEMT and EPI samples (Cox proportional hazards analysis). Every curve corresponds to patients whose tumours fall in a specific EMT category, depicted using different colours. b Progression-free interval compared between the three groups (Cox proportional hazards analysis). c Genomic markers distinguishing between mesenchymal and epithelial states with a significantly worse or improved outcome (q < 0.001). The mean hazard ratios for overall survival and corresponding confidence intervals from the Cox proportional hazards analysis are indicated for each marker. The colour of the dot indicates whether the marker is linked with better or worse prognosis. d Genomic markers distinguishing between hybrid and epithelial states with a significantly worse or improved outcome. The mean hazard ratios for overall survival and corresponding confidence intervals from the Cox proportional hazards analysis are indicated for each marker. The colour of the dot indicates whether the marker is linked with better or worse prognosis. WGD = whole-genome doubling. e Correlation between the EMT scores and IC50 values in cell lines treated with various drugs. The balloon chart on the left illustrates the association between the IC50 for each compound and EMT. The size of the circles is proportional to the significance of association, and the colour corresponds to the Pearson correlation coefficient. The IC50 ranges for all cell lines are depicted by the density charts and their colour gradient. f EMT scores compared between responders (complete, n = 31; partial, n = 5) and non-responders (stable, n = 9; progressive, n = 18) to treatment with oxaliplatin. A gradual increase in EMT levels is observed with progressively worse outcomes. Groups are depicted using different colours and compared using two-sided Wilcoxon rank-sum tests. The centerline of boxes depicts the median, and the bottom and top box edges the first and third quartiles. Source data are provided as a Source Data file.

References

    1. Thiery JP, Acloque H, Huang RY, Nieto MA. Epithelial-mesenchymal transitions in development and disease. Cell. 2009;139:871–890. doi: 10.1016/j.cell.2009.11.007. - DOI - PubMed
    1. Kalluri R, Weinberg RA. The basics of epithelial-mesenchymal transition. J. Clin. Invest. 2009;119:1420–1428. doi: 10.1172/JCI39104. - DOI - PMC - PubMed
    1. Pastushenko I, Blanpain C. EMT transition states during tumor progression and metastasis. Trends Cell Biol. 2019;29:212–226. doi: 10.1016/j.tcb.2018.12.001. - DOI - PubMed
    1. Goetz H, Melendez-Alvarez JR, Chen L, Tian XJ. A plausible accelerating function of intermediate states in cancer metastasis. PLoS Comput. Biol. 2020;16:e1007682. doi: 10.1371/journal.pcbi.1007682. - DOI - PMC - PubMed
    1. Pastushenko I, et al. Identification of the tumour transition states occurring during EMT. Nature. 2018;556:463–468. doi: 10.1038/s41586-018-0040-3. - DOI - PubMed

Publication types

Substances